Search for answers or browse articles about Sintel BI
Dynamic Column
Sintel BI has a powerful feature called ‘Dynamic Column,’ allowing users to create custom fields within a data source with values dynamically computed based on JavaScript expressions. This feature enhances the flexibility and customisation options for users working with data in Sintel BI.
When Would You Use Dynamic Columns?
Dynamic columns are incredibly useful when you want to:
- Perform custom calculations on your data, such as percentages, profit margins, or averages.
- Create conditional labels like “On Track” or “At Risk” based on specific thresholds.
- Format your data for clarity, such as adding percentage symbols (%) or rounding values.
- Combine fields, calculate date differences, or simplify large numbers (e.g., 1,000 → 1K).
- Dynamic columns allow you to enhance your dashboards and reports without needing to modify your original dataset.
Steps to Create a Dynamic Column
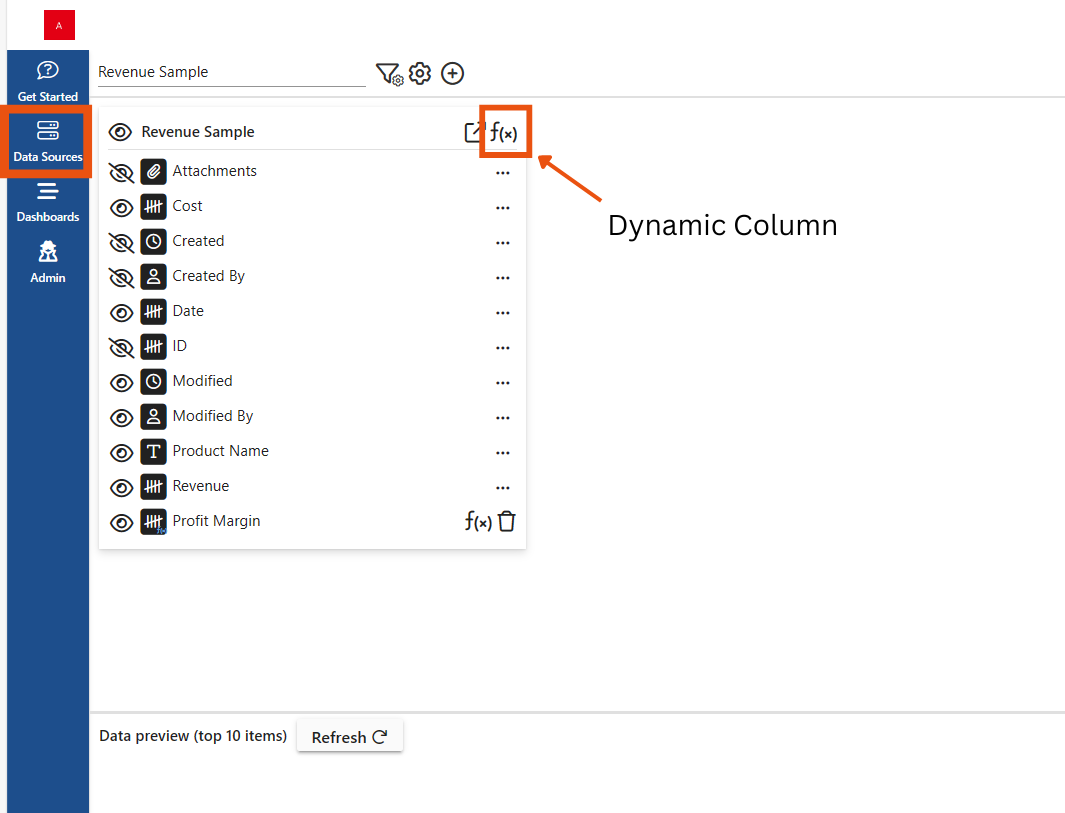
1. Navigate to Your Data Source:
Open the desired data source.
2. Open Calculated Column Settings:
Click on the f(x) icon at the top of the data source tile.
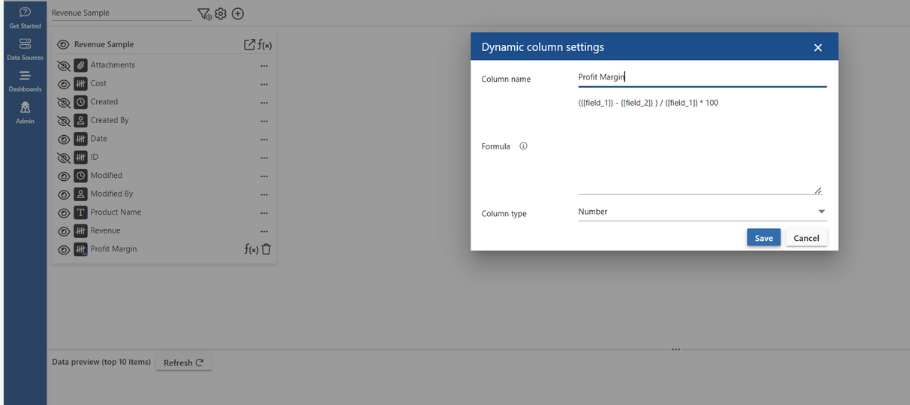
3. Name Your Column:
Enter a descriptive name for the new calculated column.
4. Enter a Formula:
- Use JavaScript expressions for calculations.
- Type @ to browse and include existing field values into your formula.
- Example: (@Revenue – @Cost) / @Revenue * 100
5. Select Column Type:
Choose the appropriate column type based on your output:
- Single Line of Text
- Number
- Date and Time
- Yes/No
- Save Your Column:
Click Save and apply it to your grid, charts, or dashboards.
Tips for Success
Refresh Your Data Preview:
After creating your dynamic column, make sure to click refresh on the data preview. This ensures that the column appears and works as expected.
Use the @ Symbol for Field Values:
When writing your formulas, the @ symbol allows you to quickly insert field values.
Examples of Dynamic Column Formulas
1. Percentage Calculation
Calculate the percentage of completed tasks.
Column Type: Number
@Completed > 0 && @Total > 0 ? (@Completed / @Total) * 100 : 0
2. Round to the Nearest Whole Number
Round the percentage to the nearest integer.
Column Type: Number
@Completed > 0 && @Total > 0 ? Math.round((@Completed / @Total) * 100) : 0
3. Add a Status Label
Mark tasks as “Complete” or “In Progress”.
Column Type: Single Line of Text
@Completed == @Total ? "Complete" : "In Progress"
4. Conditional Labeling
Add “High Priority” for urgent tasks.
Column Type: Single Line of Text
@Priority == "High" ? "High Priority" : "Normal Priority"
5. Calculate Days Between Dates
Find the difference in days between two dates.
Column Type: Number
DateTime.fromISO(@EndDate).diff(DateTime.fromISO(@StartDate), 'days').days
6. Append a Symbol to a Value
Add a dollar sign to a revenue column.
Column Type: Single Line of Text
"$" + @Revenue
7. Calculate Profit Margin
Scenario: Calculate profit margin as a percentage.
Column Type: Number
@Revenue > 0 ? ((@Revenue - @Cost) / @Revenue) * 100 : 0
8. Categorise Sales Performance
Label sales as “High”, “Medium”, or “Low”.
Column Type: Single Line of Text
@Sales >= 1000 ? "High" : @Sales >= 500 ? "Medium" : "Low"
9. Show Current Date
Display today’s date dynamically.
Column Type: Date and Time
DateTime.now().toISODate()
10. Check If a Date Has Passed
Determine if a deadline is in the past.
Column Type: Single Line of Text
DateTime.fromISO(@Deadline).diffNow('days').days < 0 ? "Overdue" : "On Time"
11. Calculate Tax
Calculate 15% tax on revenue.
Column Type: Number
@Revenue * 0.15
12. Format Large Numbers
Convert numbers into shortened formats.
Column Type: Single Line of Text
@Value >= 1000000 ? (@Value / 1000000).toFixed(1) + "M" : @Value >= 1000 ? (@Value / 1000).toFixed(1) + "K" : @Value
13. Combine Two Fields
Combine first and last names into a full name.
Column Type: Single Line of Text
@FirstName + " " + @LastName
14. Convert to Uppercase
Scenario: Transform text to uppercase.
Column Type: Single Line of Text
@FieldName.toUpperCase()
15. Default Value for Missing Data
Replace missing data with “N/A”.
Column Type: Single Line of Text
@FieldName ? @FieldName : "N/A"
16. Add a Rank Prefix
Add “Rank” to a numeric rank column.
Column Type: Single Line of Text
"Rank " + @Rank
17. Show Month Name from Date
Extract the month name from a date.
Column Type: Single Line of Text
DateTime.fromISO(@Date).toFormat('MMMM')18. Compare Two Columns
Compare revenue against a target.
Column Type: Single Line of Text
@Revenue >= @Target ? "Met Target" : "Below Target"
19. Calculate a Weighted Score
Compute a weighted average score.
Column Type: Number
(@Score1 * 0.5) + (@Score2 * 0.3) + (@Score3 * 0.2)
20. Check for Zero Values
Avoid division by zero when calculating ratios.
Column Type: Number
@Total > 0 ? @Value / @Total : 0
21. Show Percentage Rounded to the Nearest Whole Number with % Symbol
Calculate the percentage of completed tasks out of the total, round to the nearest whole number, and append the % symbol.
Column Type: Number
@Completed > 0 && @Total > 0 ? Math.round((@Completed / @Total) * 100) + "%" : "0%"