Search for answers or browse articles about Sintel BI
Pivot Grid
A Pivot grid enables you to display summarized data in cross tabular format i.e. in rows and columns.
Pivot grids are very useful with large amounts of data. You can arrange your grid so the information is displayed in a simple, meaningful layout.
Pivot Grid
When adding a pivot grid you will need to add a minimum of one column and one row.
It is also possible to add a column but hide it from view on your dashboard. That means the data won’t be visible on your dashboard but it can be used for filtering other components on the dashboard.
Step 1 Add the Pivot Grid Component
- Drag and drop the Grid icon from the container on the left of your dashboard when in design view.
- Adjust the grid according to the required size.
Step 2 Naming the Component
If you select the empty grid component it will open the properties pane on the right-hand side. I always like to start by naming my new component and giving it a description and an icon.
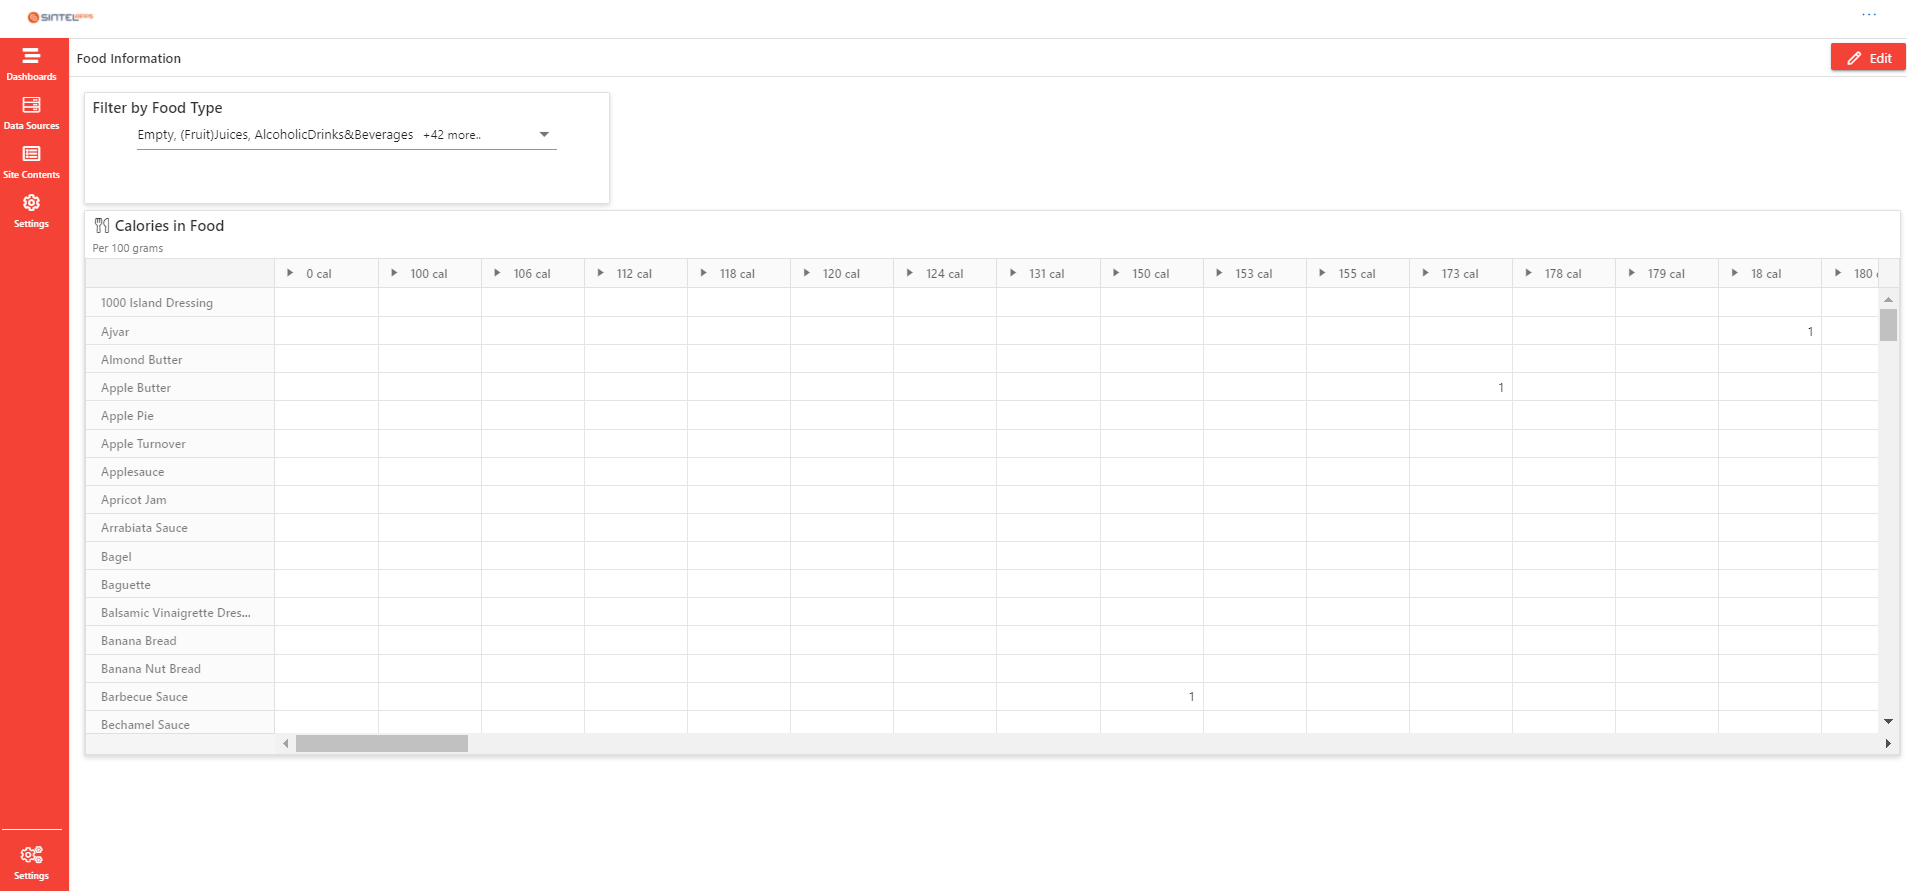
In this example, I am going to make the pivot grid display information about different foods.
In the Basic settings section, you are given an option on how to display ‘Grand totals’.
If you were calculating totals in your pivot grid you can choose where they are displayed. The options are:
- Columns
- Rows
- Rows & Columns
- None
As my grid is simply providing information about calories in food, I chose to switch this to ‘None’.
Naming the grid and giving it an icon.
Step 3 Assign the data to the Component
- From the properties pane, you can select Assign Data.
- Here you can select your Data Source. If you are trying to select a data source, but there are no options to select, check out this article which shows you how to first define a data source.
- Once you have selected your data sources it is time to add the relevant columns into the values, columns and rows sections.
Assigning and Organising the Data
Once you have added your pivot grid component and assigned data to it, make sure you save your work.
If you liked this article and would like to learn more about other components, click here.
To learn more about Sintel check our features or testimonials.
If you would like to learn more about Sintel Forms or Sintel BI book a no-obligation demo.
For the latest updates follow us on LinkedIn/Twitter & YouTube.