Search for answers or browse articles about Sintel BI
Custom HTML
The HTML Component is a new feature in the General Section of Sintel BI components. It allows users to embed custom HTML and CSS content within their dashboards, providing flexibility for personalising and integrating dynamic content. Whether you’re embedding a custom report, adding a styled text box, or incorporating external content such as forms or widgets, the HTML component makes it possible.
This guide explains how to add and configure the HTML component, highlights its key properties, and offers tips on effective usage.
Steps to Add and Configure the HTML Component
1. Adding the HTML Component
Step 1: Go to the General Section in the Sintel BI components menu.
Step 2: Drag the HTML Component into your dashboard workspace.
Step 3: Resize the component by dragging its edges until it fits your preferred size.
2. Configuring the HTML Component
Once you’ve added the component, use the properties panel on the right-hand side to adjust its settings.
– Security Access
This section allows you to control who can view or manage the HTML component.
Set Current Access: Configure the security level for the component.
Lock Icon: Indicates if the component is public (visible to everyone) or private (visible only to administrators).
Manage Access (Arrow Icon): Clicking this icon allows you to:
- Set the component to public or private.
- Grant direct access to specific users or groups.
– Look and Feel
This section allows you to customise the visual appearance of the HTML component.
Elevated Border: Adds a border to make the component stand out. We recommend turning the elevated border off when using the HTML component in many situations.
Hide on Mobile: Opt to hide the component when viewed on mobile devices for better layout management.
– Basic Settings
Here you can enter the HTML and CSS that will be displayed within the component.
HTML and CSS Editor: Input your custom code for immediate styling and layout adjustments.
Preview: Use the Advanced Editor to preview how the component will look with your HTML and CSS before saving.
3. Advanced Editor
The Advanced Editor provides additional functionality for editing your HTML and CSS code. It allows you to:
- Write or adjust both HTML and CSS.
- See a preview of your changes in real time.
- Save your work to finalise the look and feel of the component.
4. Examples
– Interactive Notification Card with Animation

Create a notification card with an animated entry effect to grab users’ attention for important updates. This notification card uses a subtle sliding animation to make the announcement more noticeable, without being too intrusive. It’s perfect for alerting users about key updates.
<style>
  .notification {
    background-color: #f0f8ff;
    border-left: 5px solid #0073e6;
    padding: 20px;
    margin: 10px 0;
    transition: transform 0.3s ease-in-out;
    transform: translateX(-20px);
    animation: slideIn 1s forwards;
  }

  @keyframes slideIn {
    from {
      opacity: 0;
      transform: translateX(-20px);
    }
    to {
      opacity: 1;
      transform: translateX(0);
    }
  }

  .notification h3 {
    margin-top: 0;
  }
</style>

<div class="notification">
  <h3>? Upcoming Event</h3>
  <p>Join us for the <strong>Annual Performance Review</strong> on <strong>Monday, 25 October</strong>, from <strong>9 AM to 12 PM</strong>. Check your email for the meeting link.</p>
</div>
– Embedded YouTube Video with Styled Frame
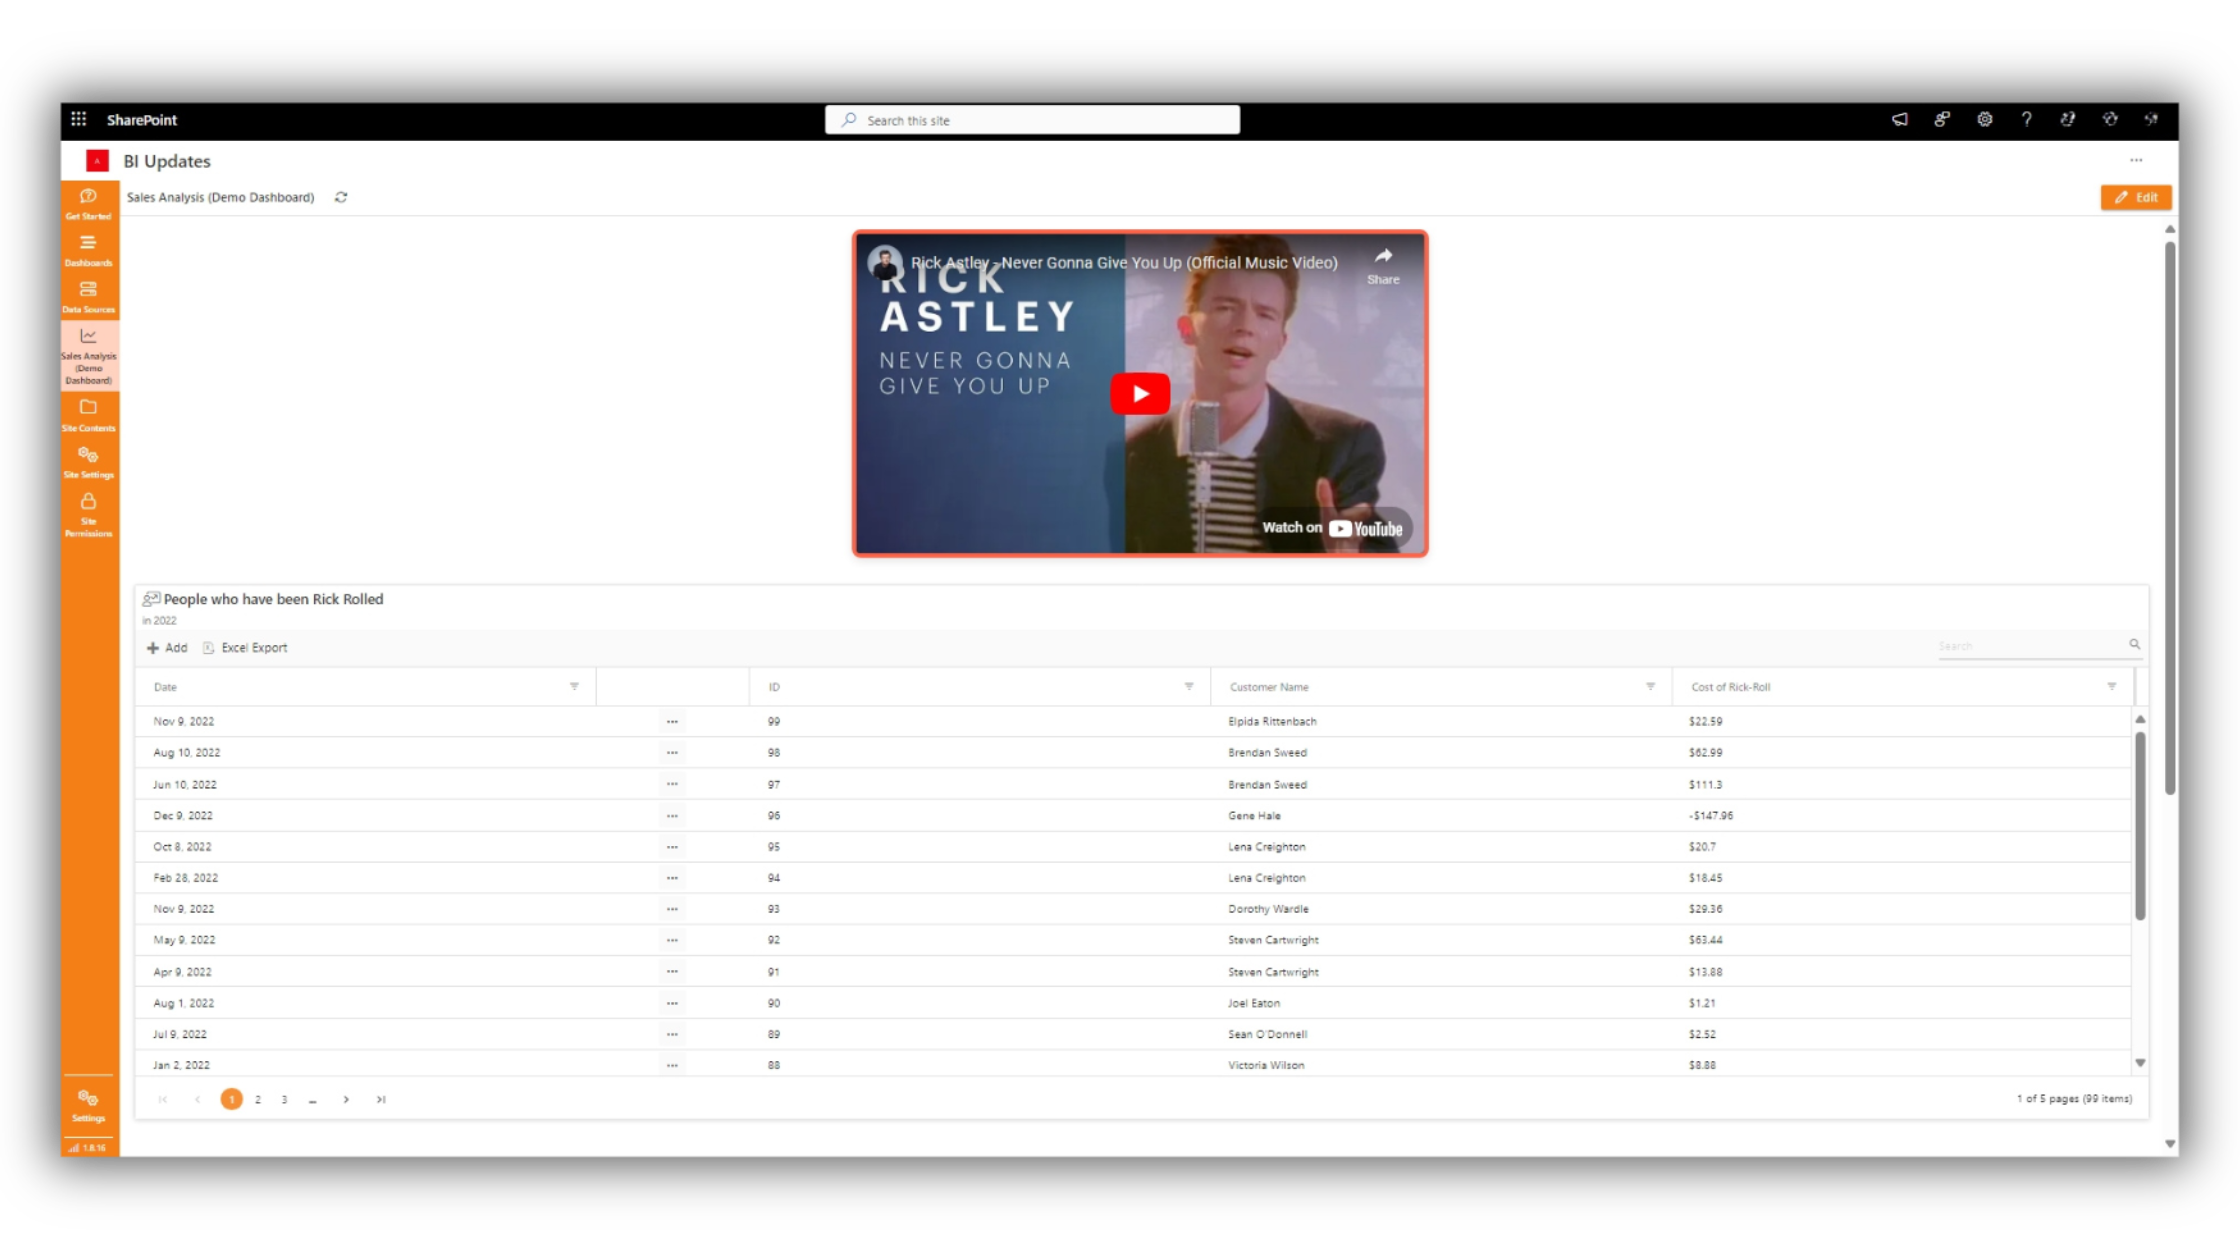
Embed a YouTube video inside a custom-styled frame, perfect for training videos or product demonstrations. Instead of just pasting a video link, this example wraps the video in a sleek, professional frame with shadows and a border, enhancing the presentation. Ideal for media-rich dashboards.
<style>
  .video-frame {
    border: 5px solid #ff6347;
    border-radius: 10px;
    overflow: hidden;
    box-shadow: 0 4px 10px rgba(0, 0, 0, 0.1);
    width: 100%;
    max-width: 640px;
    margin: 0 auto;
  }

  .video-frame iframe {
    display: block;
    width: 100%;
    height: 360px;
  }
</style>

<div class="video-frame">
  <iframe src="https://www.youtube.com/embed/dQw4w9WgXcQ" frameborder="0" allowfullscreen></iframe>
</div>
– Embedded Weather Widget
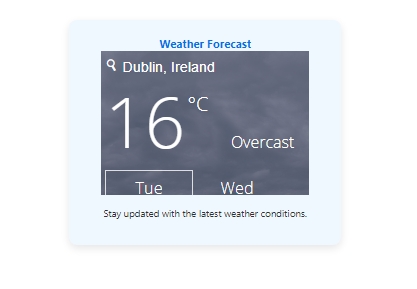
Provide a live weather widget for users to see the current forecast. This could be useful for dashboards that relate to logistics, travel, or events. Having a real-time weather widget embedded in your dashboard adds functionality and can be directly useful in certain contexts like event planning or supply chain management.
<style>
  .weather-widget {
    width: 100%;
    max-width: 300px;
    margin: 20px auto;
    text-align: center;
    background: #f0f8ff;
    padding: 20px;
    border-radius: 10px;
    box-shadow: 0 4px 10px rgba(0, 0, 0, 0.1);
  }

  .weather-widget h3 {
    margin: 0;
    color: #0073e6;
  }
</style>

<div class="weather-widget">
  <h3>Weather Forecast</h3>
  <iframe src="https://www.meteoblue.com/en/weather/widget/three?geoloc=fixed&day=0&tempunit=CELSIUS&windunit=METER_PER_SECOND&layout=image"
          frameborder="0" scrolling="NO" width="260" height="180" allowtransparency="true"></iframe>
  <p>Stay updated with the latest weather conditions.</p>
</div>
– Interactive Timeline

Showcase the history of your company, product development stages, or key milestones with an interactive timeline. This timeline adds structure and storytelling to reports. It’s visually appealing and great for showcasing achievements, milestones, or historical data.
<style>
  .timeline {
    position: relative;
    margin: 20px 0;
    padding: 10px 0;
    list-style-type: none;
  }

  .timeline::before {
    content: '';
    position: absolute;
    left: 50%;
    width: 2px;
    height: 100%;
    background-color: #0073e6;
    transform: translateX(-50%);
  }

  .timeline-item {
    position: relative;
    width: 50%;
    padding: 10px 20px;
    box-sizing: border-box;
  }

  .timeline-item:nth-child(odd) {
    left: 0;
    text-align: right;
  }

  .timeline-item:nth-child(even) {
    left: 50%;
  }

  .timeline-item p {
    margin: 0;
    background-color: #f0f8ff;
    padding: 10px;
    border-radius: 10px;
    box-shadow: 0 4px 10px rgba(0, 0, 0, 0.1);
  }
</style>

<ul class="timeline">
  <li class="timeline-item">
    <p>? 2022: Company founded</p>
  </li>
  <li class="timeline-item">
    <p>? 2023: First product launch</p>
  </li>
  <li class="timeline-item">
    <p>? 2024: Global expansion</p>
  </li>
  <li class="timeline-item">
    <p>? 2025: Award for best innovation</p>
  </li>
</ul>