Search for answers or browse articles about Sintel BI
How to use Sintel BI
Sintel BI makes it really easy to create dashboards containing components such as grids, charts, images, text and summary cards.
This article gives you an overview of how to use it.
To create an app using Sintel BI, all you have to do is: Define a Data Source → Create a Dashboard → Share it with users.
#1 Define the Data Source

A data source provides the data to components on a dashboard. Once you connect a data source to a component you can then visualise the data in a number of ways including data grids and charts. For example, if you have data in a SharePoint list such as an orders list, you simply create a data source from the list and then connect the data source to components on a dashboard.
Creating the data sources is simple and only requires that you select the source, choose the columns of data you want to include and finally apply any filters you may need.

Creating a Data Source
1.1 Select data source on the left navigation menu and select where you would like to source your data. Your options are:
- Local Data
- SharePoint (External)
- OneDrive
- Dropbox
- Excel
1.2 Once you select your list, you can provide a name for your new data source and then proceed.
1.3 The new data source will be opened and you can configure it including:
- Showing or hiding fields by selecting/deselecting the eye icon
- Change the order of fields using drag and drop
- Apply filters to fields to exclude data
- Click Refresh to get a preview of your data
1.4 Once you complete your configuration you can either Save or Save and Exit to return to the Data Sources screen.
1.5 On the Data Sources screen, you can hover over any data source to Edit, Clone or Delete it.
#2 Create the Dashboard

Creating the dashboard generally involves adding components, connecting those components to data sources and then customising the display of the data.
When creating a dashboard the drag and drop interface of Sintel BI enables you to easily resize the various components to configure any layout you need.
Create a Dashboard and set its properties
2.1 To add a new dashboard you select Dashboards on the left navigation menu and select the + button.
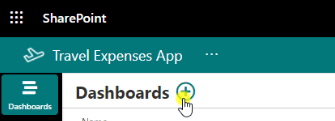
Adding a new Dashboard
2.2 You can then provide a Title, Description and Icon and configure the Look & Feel of the dashboard.
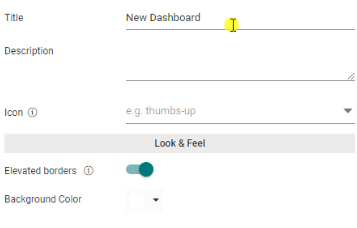
Setting Dashboard Properties
Adding Components
2.3 There are a variety of components that you can add to your dashboard using drag and drop. These include Grids, Images, Text, Summary Cards, Charts and Filters.

Choice of Components
2.4 The settings you can configure on each varies from one component to another but in general, components can be connected to a data source and then customised to display the data from that data source.
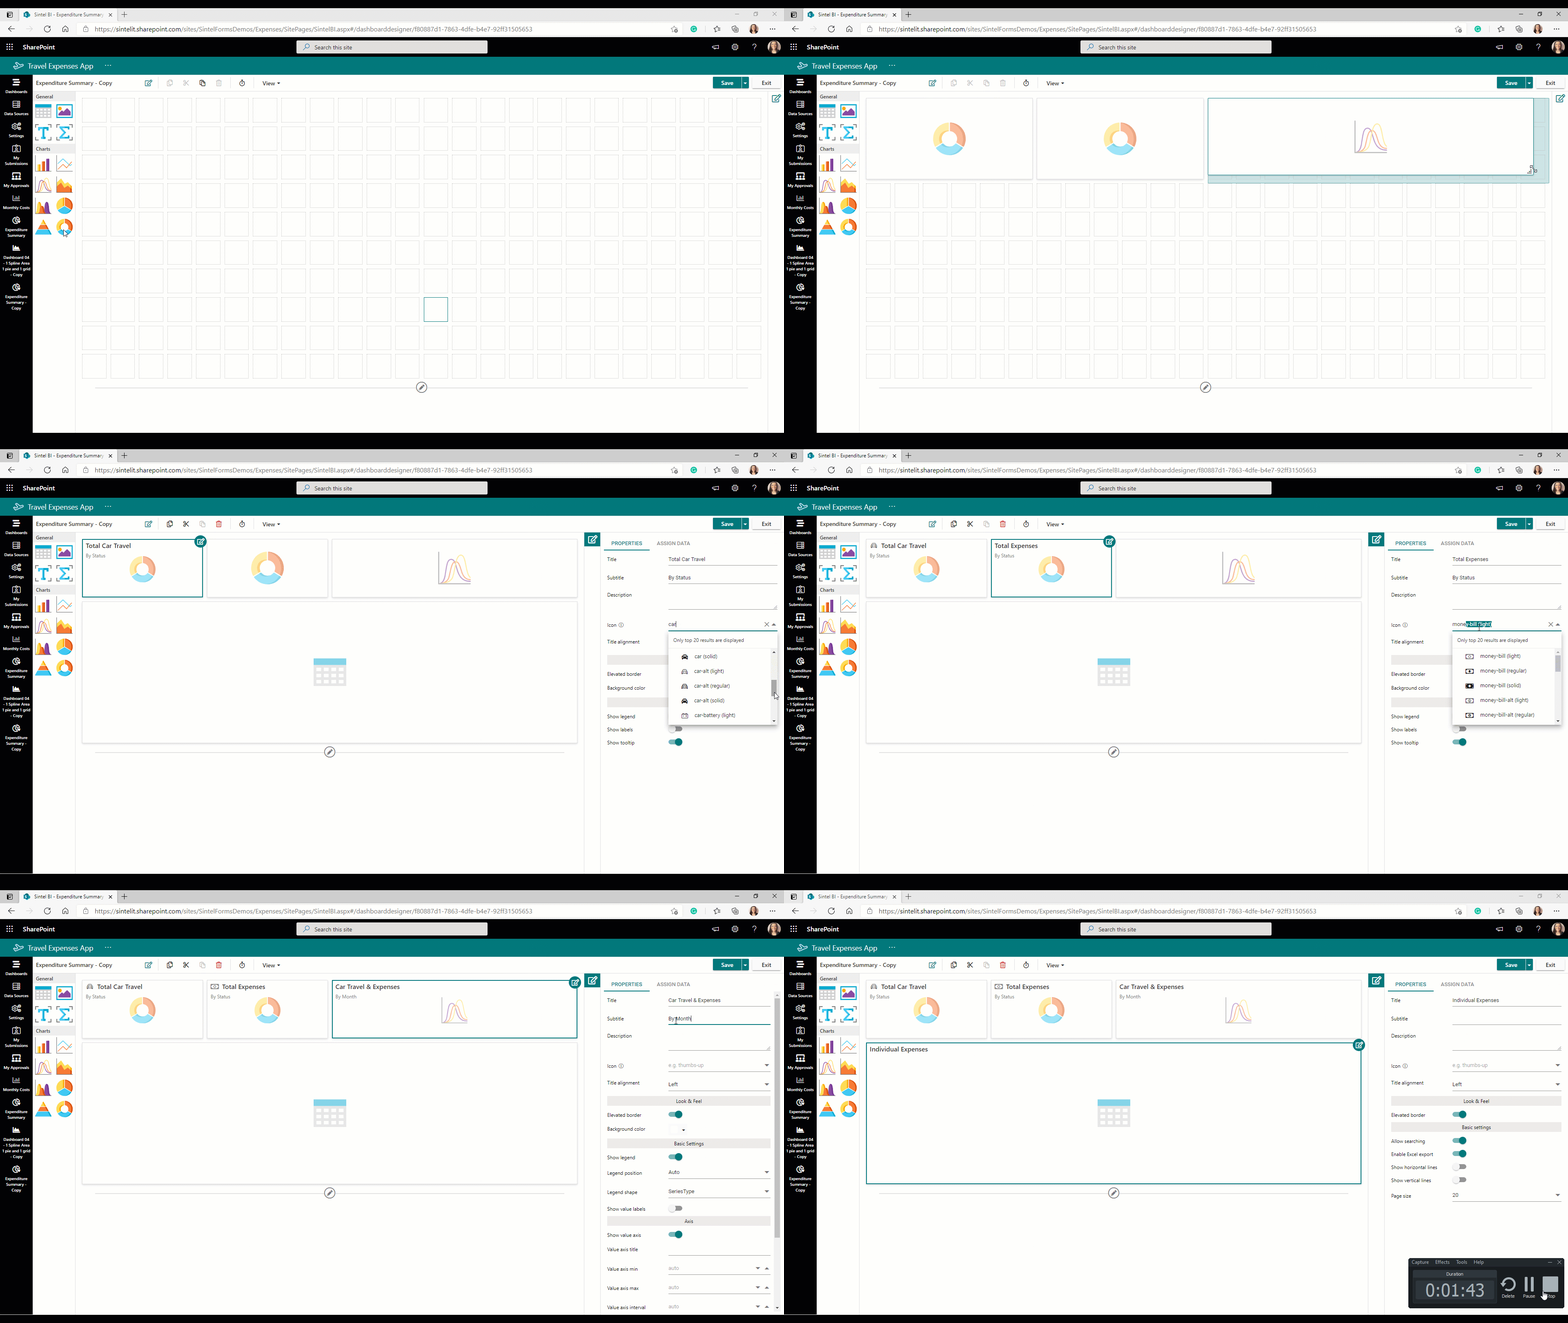
Creating the Dashboard with charts & a data grid but not yet connected to data.
2.5 One example of a component you can add is a doughnut chart. These are a popular way to display data in a very understandable format. It also enables you to adjust the inner and outer radius of the chart as well as adjusting the placement of the legend and labels.
2.6 There are many other settings that can be used so the customisation options are very extensive.
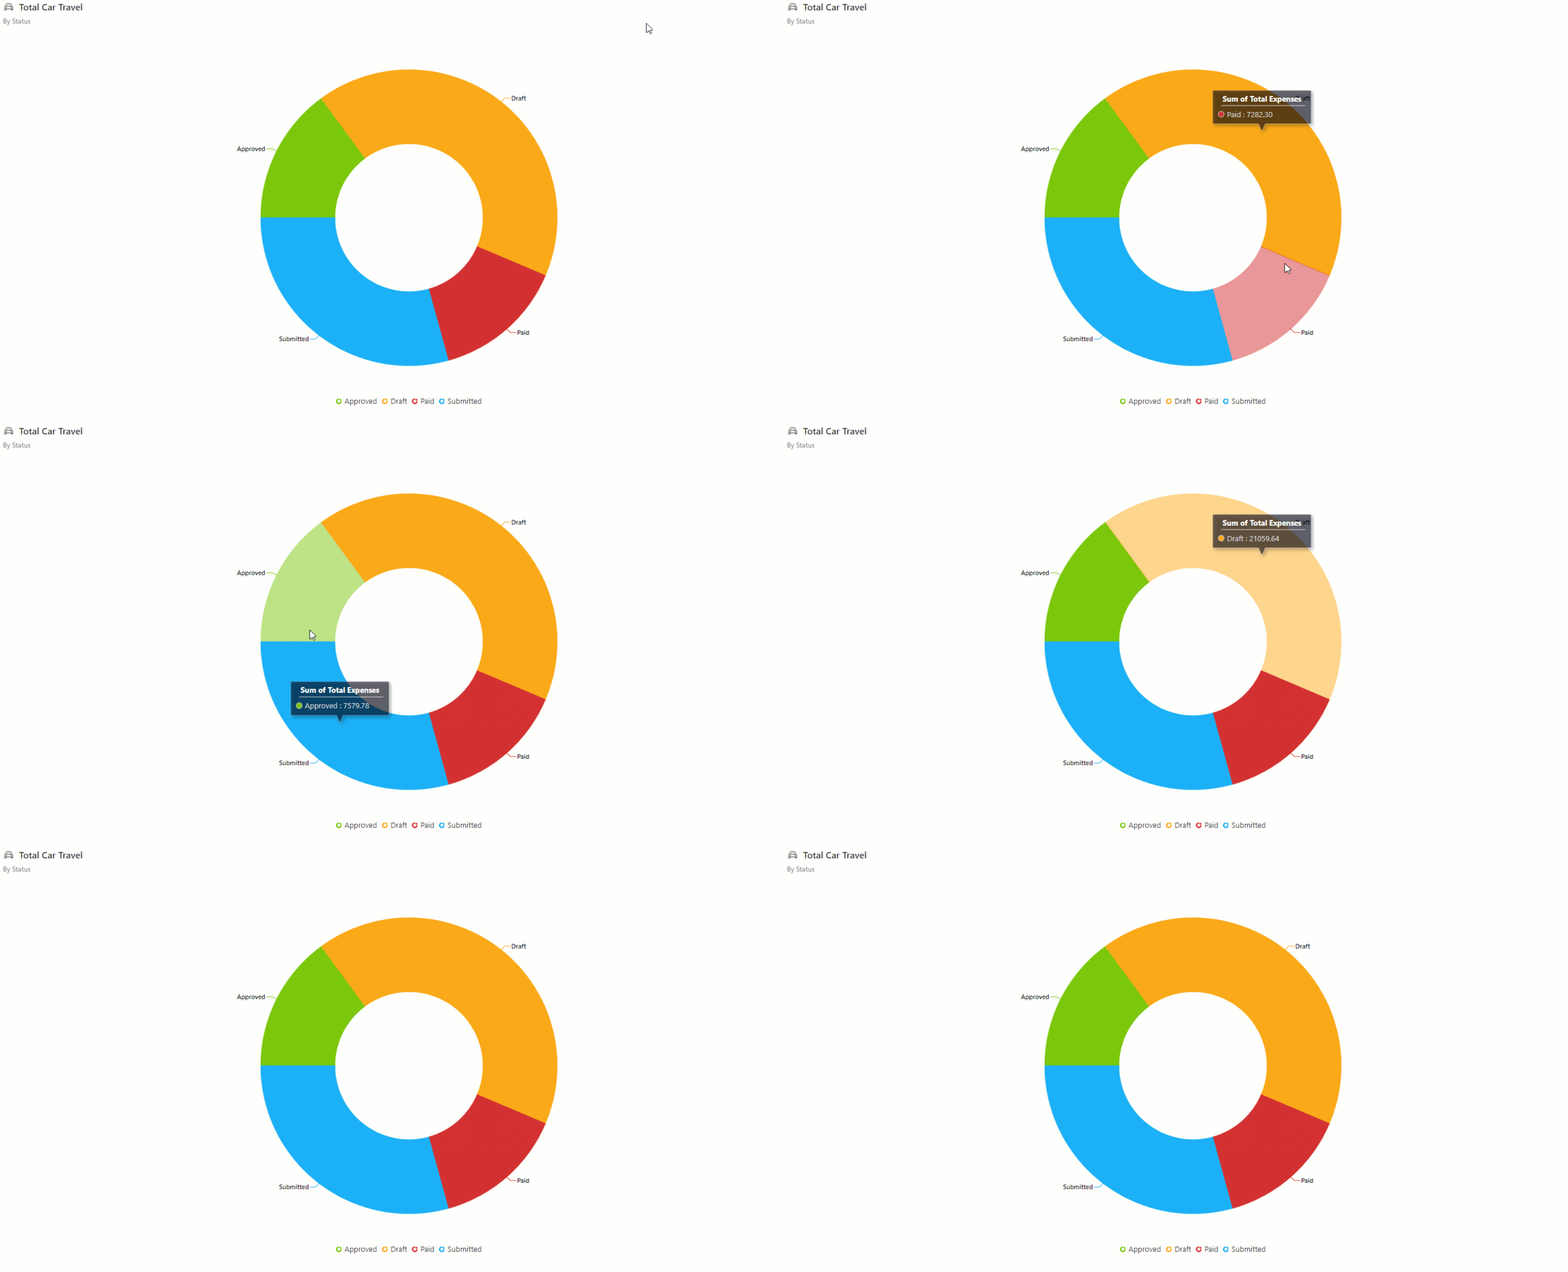
Doughnut Chart.
Bind to data
2.7 Once you add the components to your dashboard you need to connect each one to a relevant data source.
2.8 To assign the data you can select the edit icon on your empty component and then on the properties pane that opens you can select Assign Data. Here you can select your Data Source and you will then have a list of columns to choose from which you must assign to the Category and Series.
2.9 On the example above, we chose data from expense claim forms made with Sintel Forms. We wanted to display the Total Car Travel by Status on a doughnut chart. To do this we selected our data source → dragged Form Status to the Category section → dragged Total Expenses to the Series section.

Saving the Dashboard
2.10 Once you are done make sure to save your dashboard.
#3 Share it with users

Sharing your dashboards is very simple.
When sharing you can decide to:
- Make the dashboard Public (meaning it’s visible to everyone in your organisation).
- Grant access to specific users or groups to view or edit a dashboard.

Managing Access & Edit/Clone/Delete Settings
Just like Data Sources, you can also Edit, Clone, and Delete a dashboard.
#4 Other Settings

Sintel BI provides a customisable navigation mechanism whereby all the unnecessary SharePoint elements are hidden. This enables you to create custom apps that leverage the SharePoint platform but only provide users with the links and screens they need to use your app. All unnecessary SharePoint content and links are hidden from view.
The settings screen is divided into General, Theme and Navigation and allows you full control over any apps you create with Sintel BI.
General

General Settings
- Decide if the Show ‘Dashboards’ link is enabled or disabled (we recommend this is disabled)
- Set Landing page (this is the page that will open when a user opens the site, make sure the landing page is set to allow public viewing)
Theme
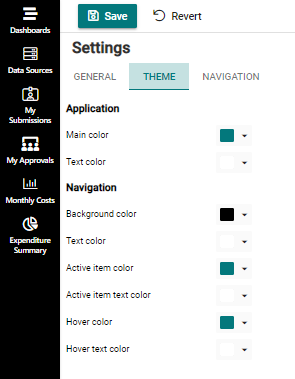
- You can set Application and Navigation colours so the dashboard is in line with your companies brand guidelines.
- We also recommend that you use the standard SharePoint site settings to customise the site in line with your organisations’ branding.
- To do so go to Settings-→ Change the look→ Choose an appropriate Theme → Set the Header layout to Minimal or Compact →Set Site logo thumbnail and Site logo
Navigation
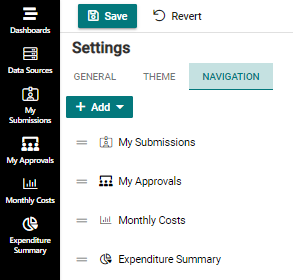
- Add the dashboards and links that you want users to have access to on the left menu
- Change the icons, the sort order and the security on these items to ensure users only see the links/dashboards they should have access to