
Try it
  • Examples
  • Features
  • Testimonials
  • Partners
  • Pricing
  • Support
    • Sintel Apps Help
    • Sintel Apps Release History
    • Sintel BI Help
    • Sintel BI Release History
    • Webinars
    • How to video series
    • Ask the community
    • Submit a ticket
    • Request a demo
    • Compare us
  • Blog
  • Examples
  • Features
  • Testimonials
  • Partners
  • Pricing
  • Support
    • Sintel Apps Help
    • Sintel Apps Release History
    • Sintel BI Help
    • Sintel BI Release History
    • Webinars
    • How to video series
    • Ask the community
    • Submit a ticket
    • Request a demo
    • Compare us
    • For Schools
  • Blog
  • Get Started
How can we help?

Search for answers or browse articles about Sintel BI

Filter by categories Clear Results
  • Getting Started

    • What is Sintel BI
    • How to install Sintel BI
    • How to configure Sintel BI
    • How to use Sintel BI
    • How to install Sintel BI without AppSource
    • Sintel BI Best Practices
  • Data Sources

    • Data Sources
    • MS SQL
    • Excel
    • How to Merge Data Sources
  • Charts

    • Area Chart
    • Column Chart
    • Doughnut Chart
    • Line Chart
    • Pie Chart
    • Pyramid Chart
    • RAG area chart
    • RAG line chart
    • Spline Chart
    • Spline Area Chart
    • Stacked Column Chart
    • Stacked Line Chart
    • Step line chart
    • Polar Charts
    • Gauge Charts
  • Grids

    • Grid
    • Pivot Grid
    • Scheduler
  • Filters

    • Dashboard Level Filtering

      • User Filter
      • Multi-source dropdown filter
      • Dropdown Filter
      • Date Filter
      • Dashboard Override
    • Data Source Level Filtering

      • Data Source Filter
      • Dashboard Override
      • Dynamic Column
    • Filtering Guide: Understanding Your Options
  • General components

    • Image
    • Summary Card
    • Text
    • Maps
    • Kanban Board
    • Card
    • Custom HTML
    • Smart Card
    • Button
  • FAQs

    • Lists used by Sintel BI
    • Components Guide
    • Convert a Classic SharePoint site to a Modern Site
    • Permissions Required to Use Sintel BI
  • Troubleshooting

    • Cannot update the Sintel BI App
    • Cannot open Sintel Forms in a dialog
    • Blank screen when opening a dashboard
    • Warning when opening a dashboard
    • Error when attempting to view data in a data source
    • Error displaying data on a Dashboard
    • Cannot export an app due to outdated data sources
    • Cannot export an app due to error
    • How to remove or reinstall Sintel BI
    • Cannot Export a Sintel App Template due to long internal field names
    • Cannot share dashboards with AD groups
    • Warning SintelBISPSPrinciples does not exist
    • Sintel BI The Server Isnt Responding Temporary Fix And AppSource
  • Product Updates

    • Release History
    • How to update Sintel BI
  • Create App Templates

    • How to Import/Export a Sintel BI App
    • Sintel App Template Permissions
  • Settings

    • Navigation
    • The Sintel BI App Hub
  • Other

    • Web Parts
  • Advanced Features

    • Creating a Custom Landing Page in Sintel BI with CSS

Summary Card

Posted9 December 2021
Updated24 February 2022
ByAmy Dermody
You are here:
  • Main
  • General components
  • Summary Card
0 out of 5 stars
5 Stars 0%
4 Stars 0%
3 Stars 0%
2 Stars 0%
1 Stars 0%
< All Topics

Summary cards can be a helpful way of giving users a brief piece of information on your dashboard.

In this article, you will learn how to add a summary card to your dashboard.
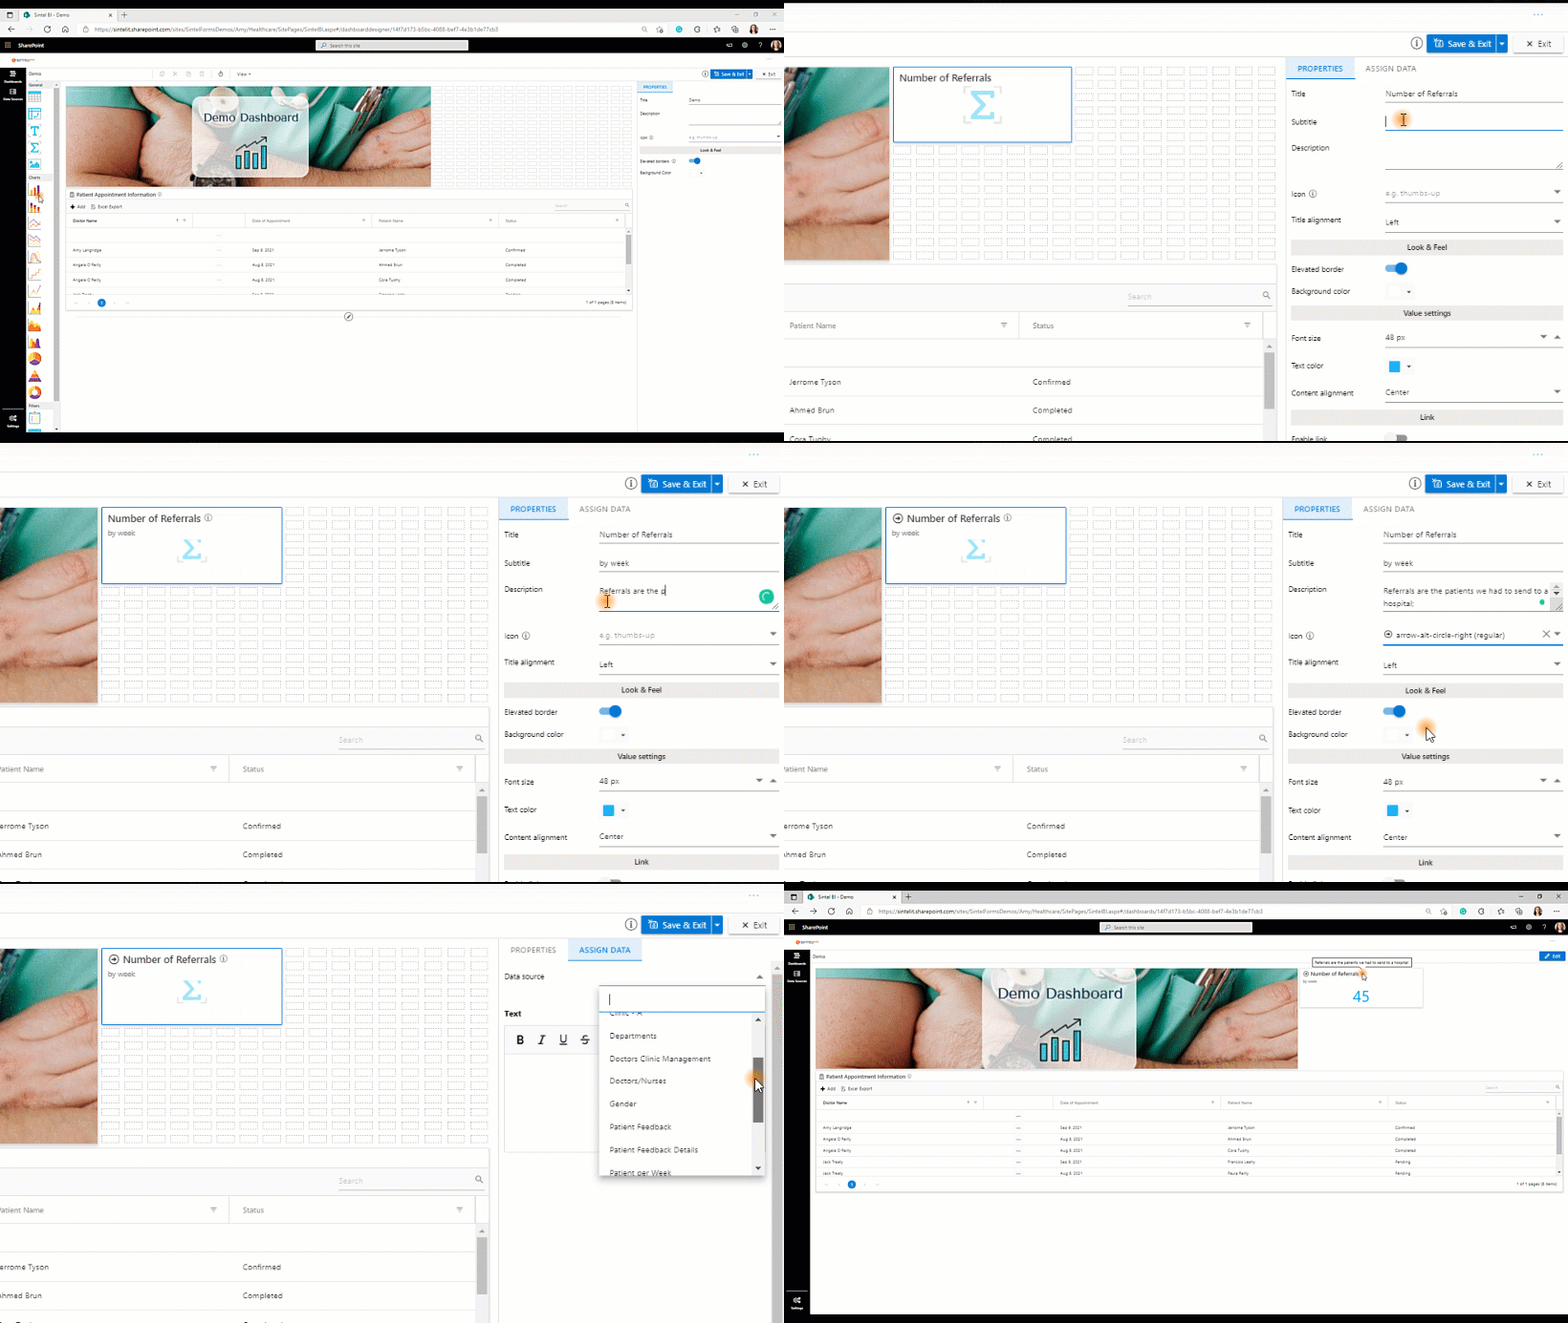
How to Add a Summary Card

Step 1 Add the summary card component
  1. Drag and drop the summary card icon from the container on the left of your dashboard when in design view.
  2. Adjust the summary card according to your desired size.
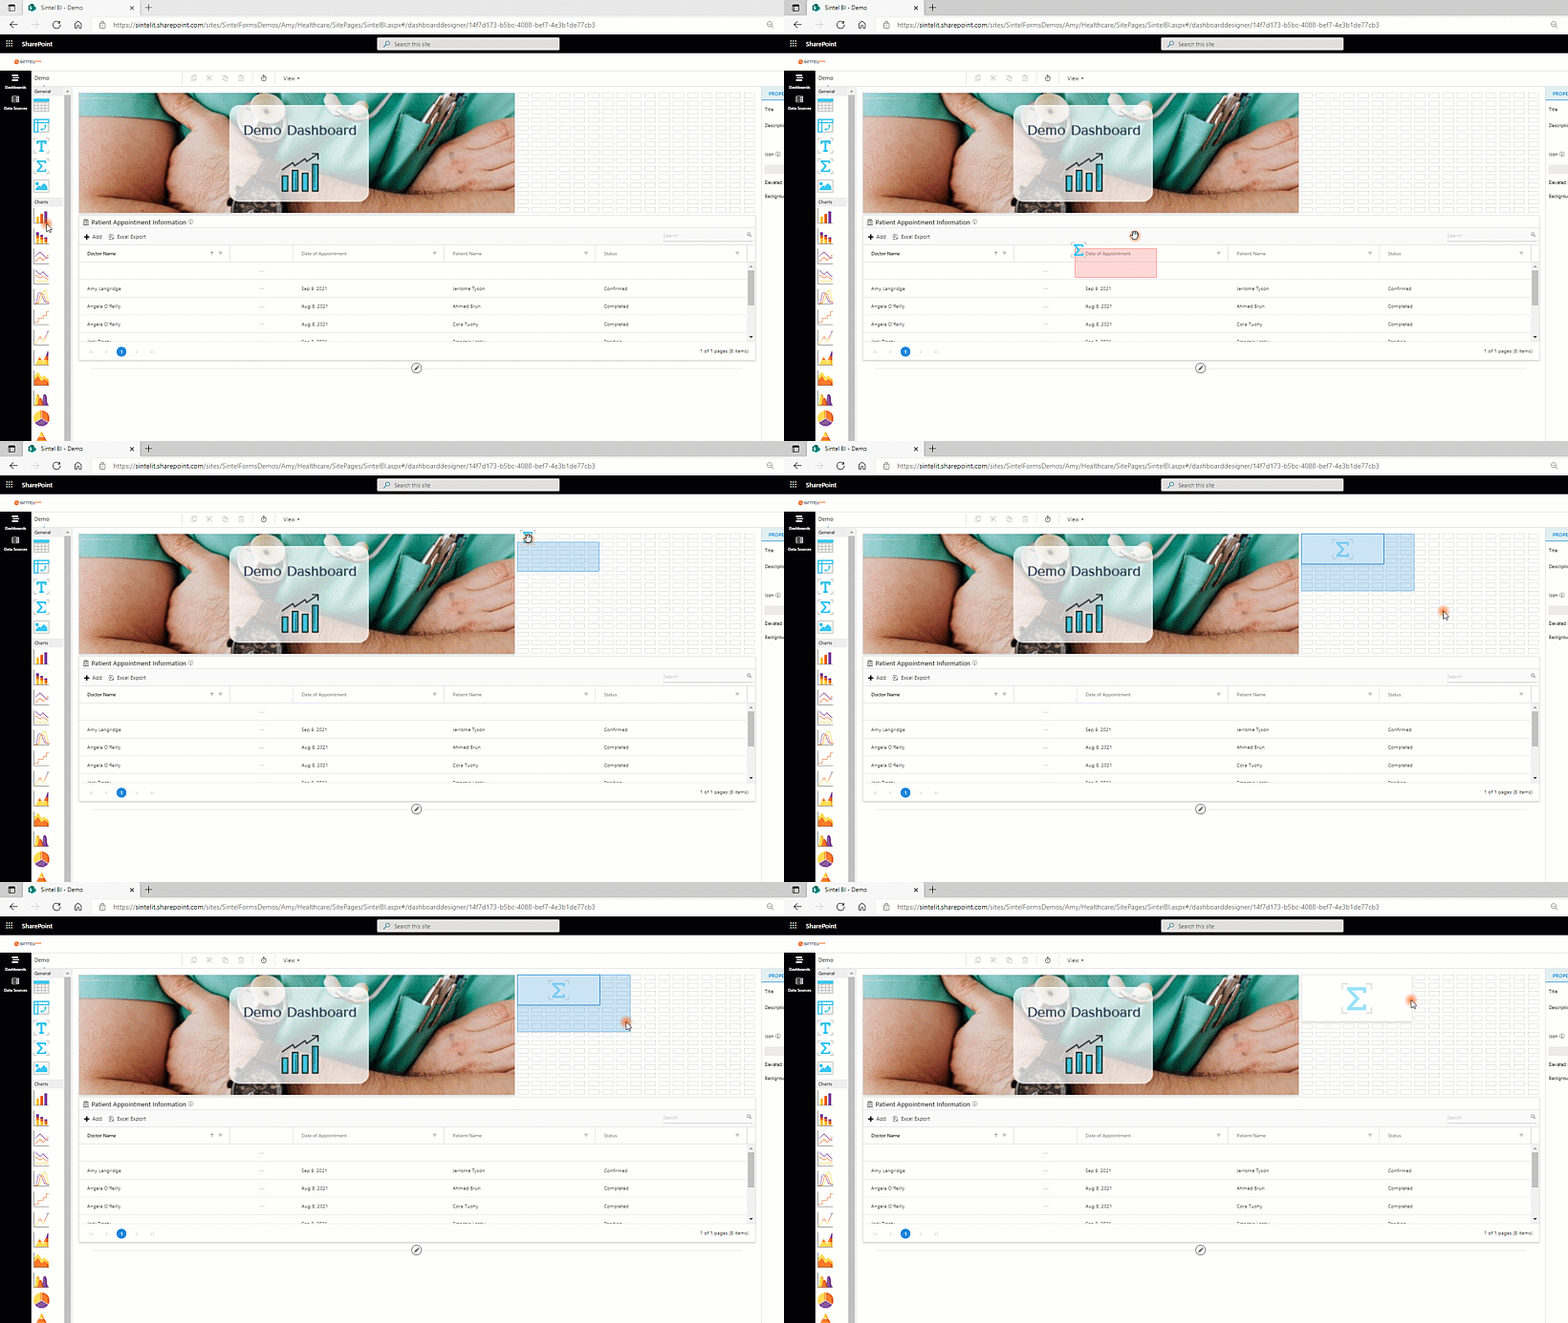
Add the summary card component

Step 2 Naming the Component 
  1. If you select your summary card it will open the properties pane on the right-hand side. I always like to start by naming my new component and giving it a description and an icon.
  2. You can choose to align the tile left centre or right.
  3. You can also give it an elevated border or change the background colour.
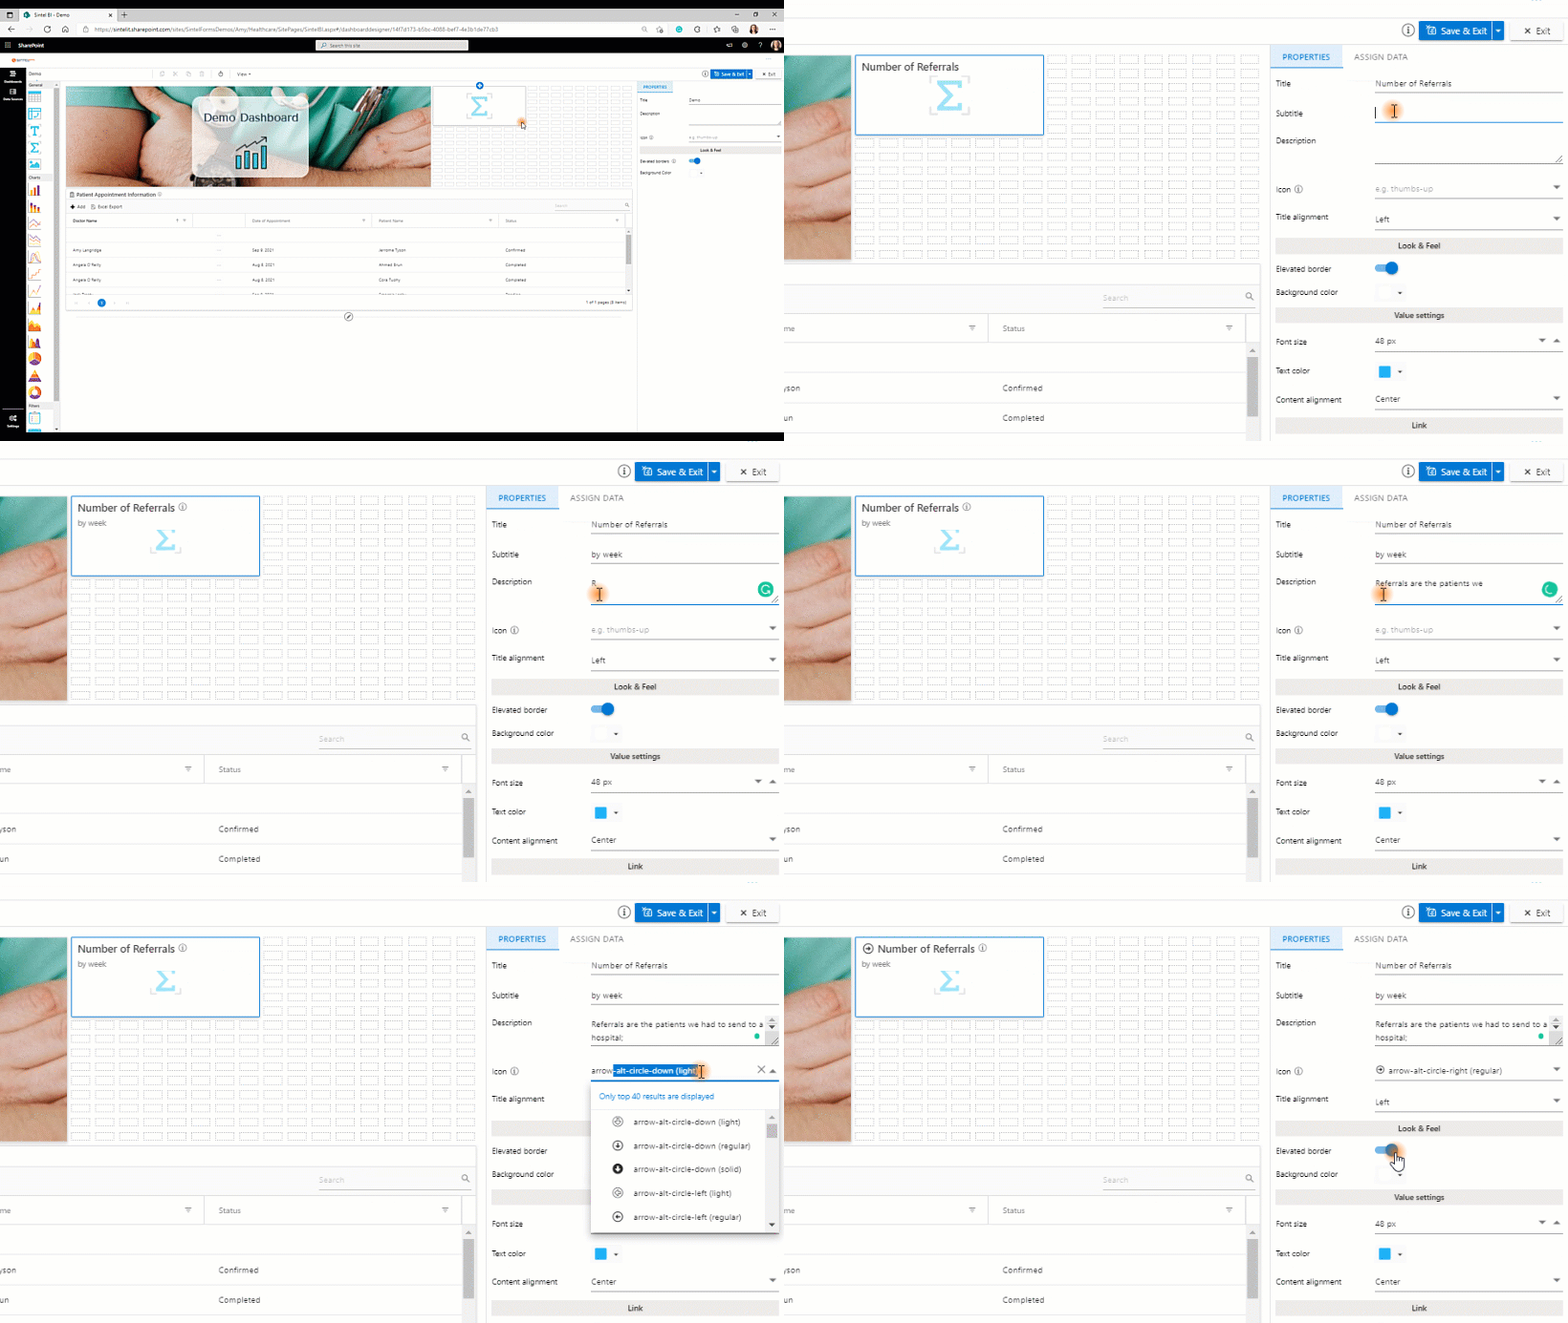
Naming the component and changing the look & feel

Step 3 Changing the Value settings
  1. By default, the font size is set to 48px and the alignment to the centre.
  2. If you wish to change the font size, colour or alignment you can easily do so in the value settings.
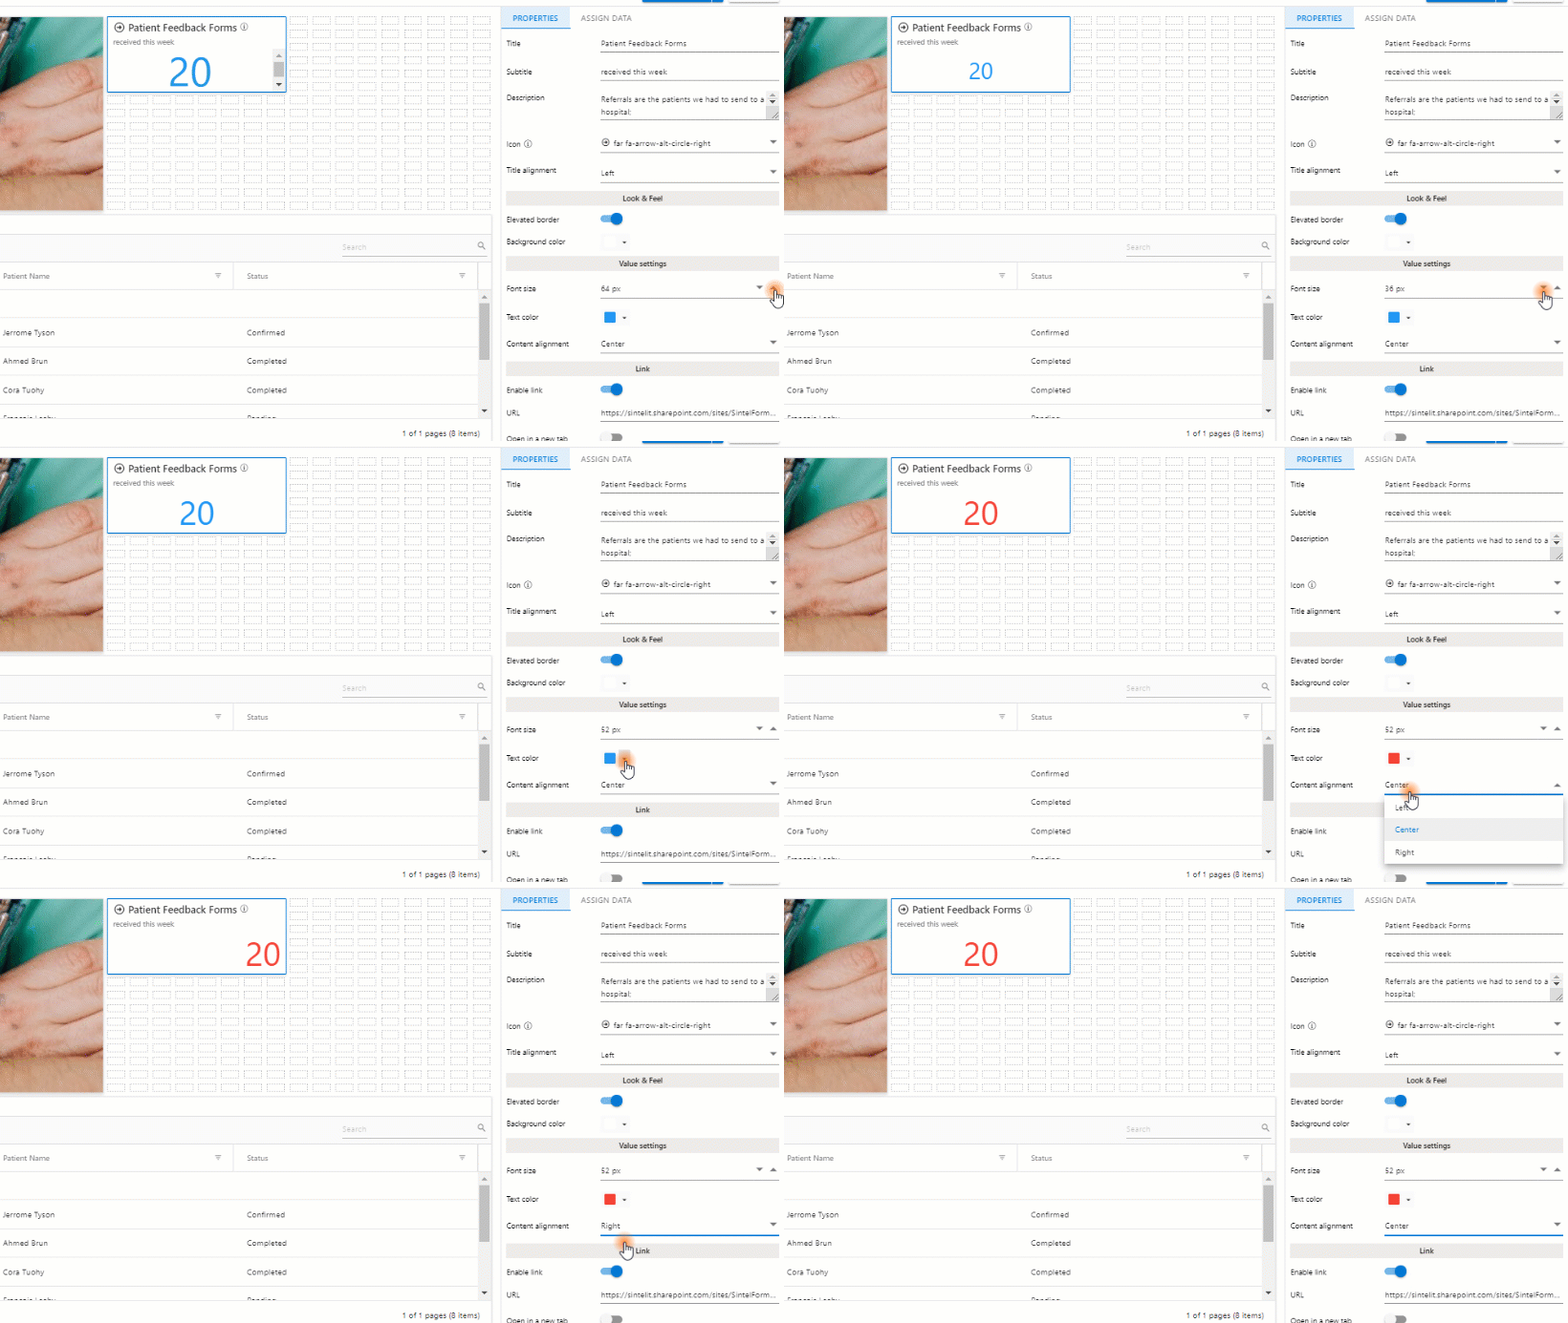
Changing the Value Settings


Step 4 Adding a Link
  1. We find making a summary card into a clickable link hugely beneficial.If you have a number of dashboards/reports you can show a piece of data featured in one dashboard on a summary card. If someone wants more information related to this data they can click on the summary card to open another dashboard/ report related to that information. Alternatively, you could set the URL to open a pre-configured Sintel Form, or to any URL link you want to re-direct the user to.
  2. To add a link to your summary card all you need to do is:
  • Switch on ‘enable link‘
  • Paste the URL of your choice into the URL bar.
  • Choose whether clicking the link opens a new tab or redirects users from your current page on the dashboard
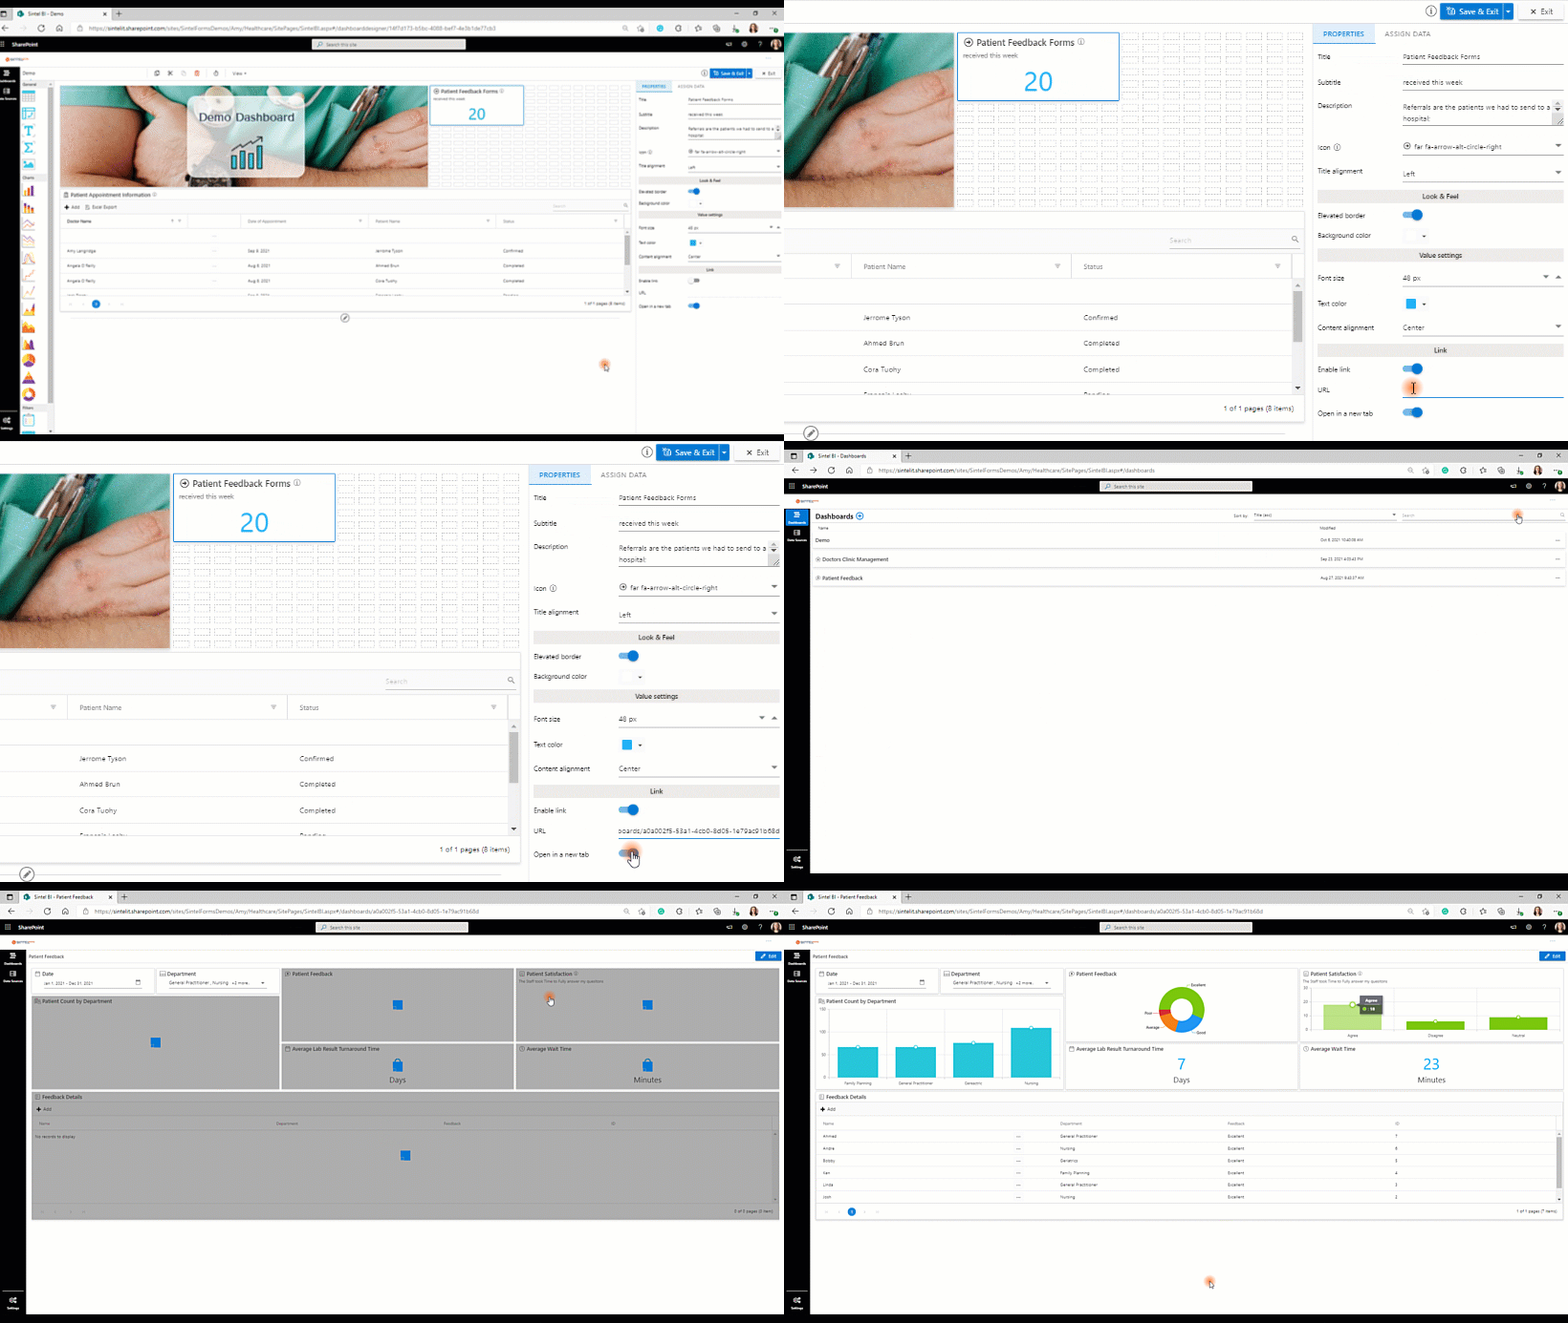
Adding a clickable link to your Summary Card

Step 5 Assign the Data
  1. From the properties pane, you can select Assign Data.
  2. Here you can select your Data Source. If you are trying to select a data source, but there are no options to select, check out this article which shows you how to define a data source.

    Assign the Data
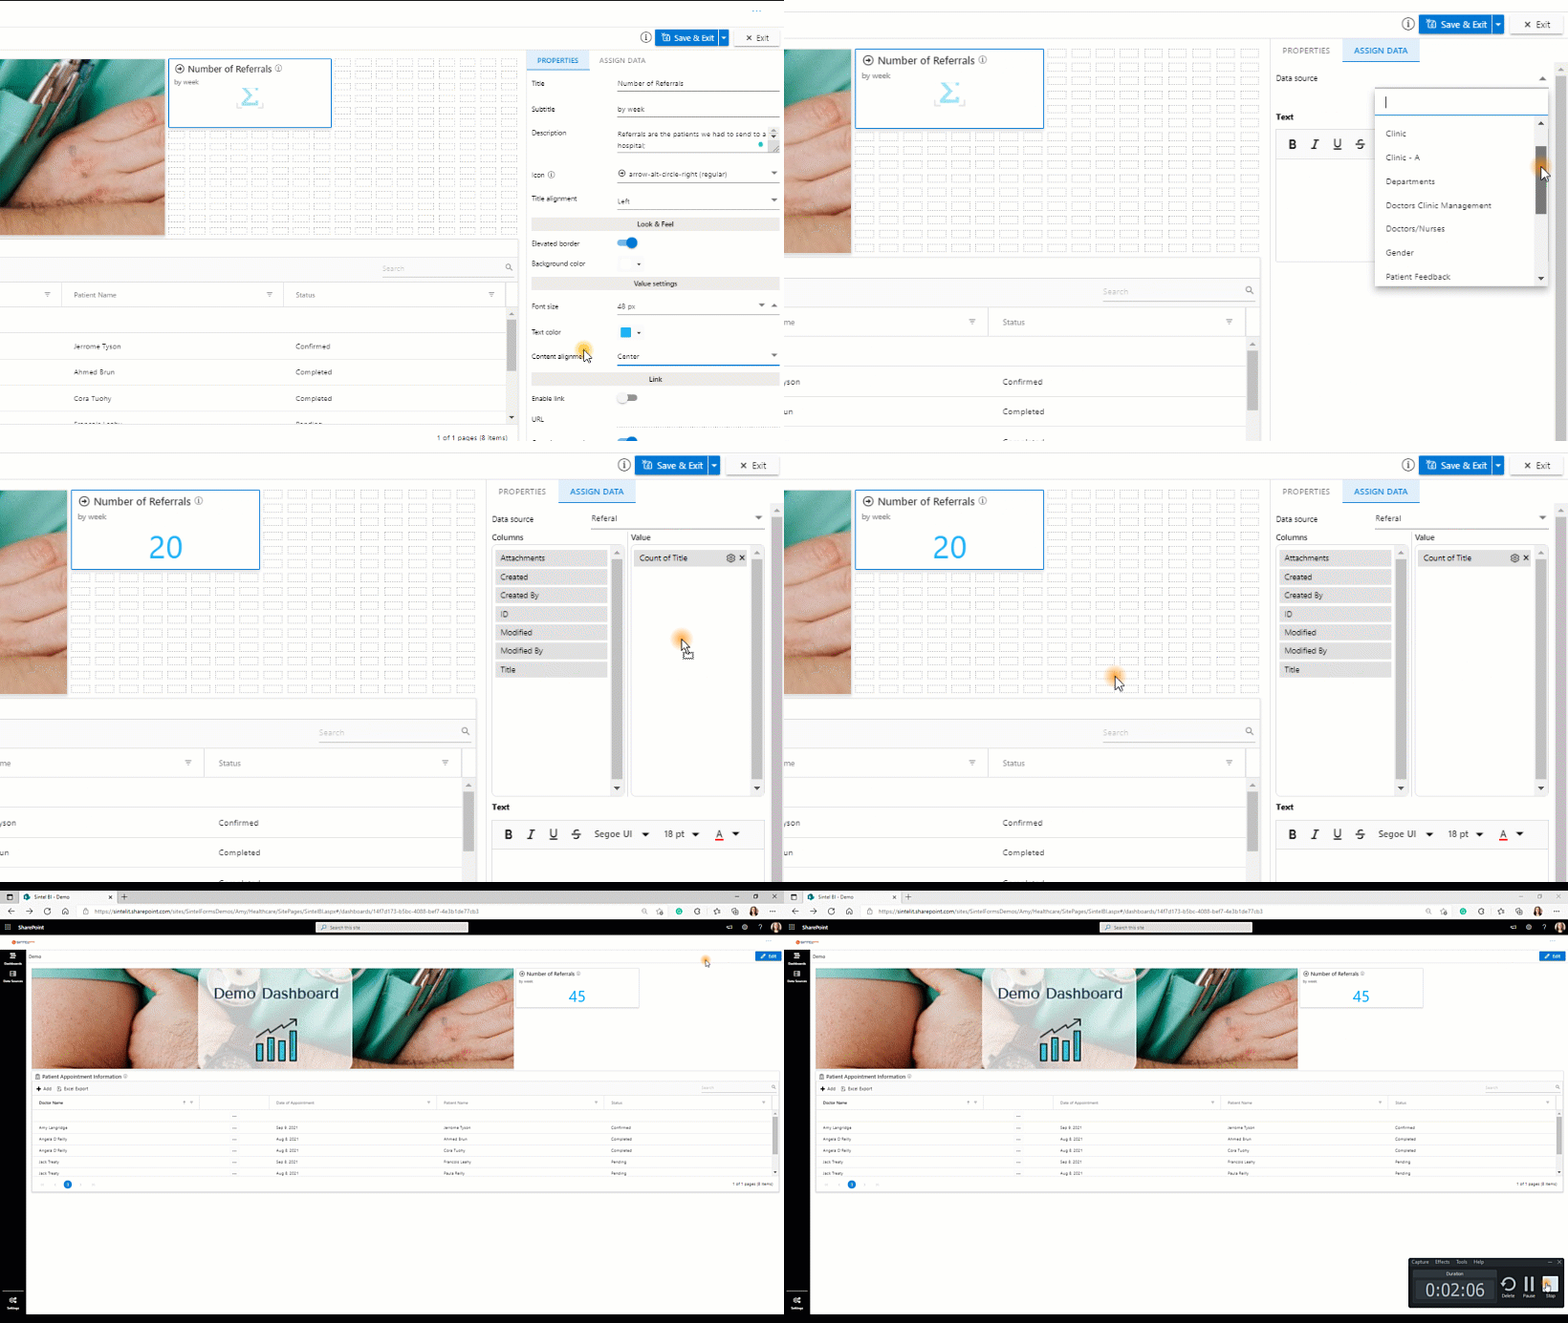
 

Once you have added your summary card component and assigned data to it, make sure you save your work.

If you liked this article and would like to learn more about other components, click here.

To learn more about Sintel check our features or testimonials.

If you would like to learn more about Sintel Forms or Sintel BI  book a no-obligation demo.

For the latest updates follow us on LinkedIn/Twitter & YouTube.

Was this article helpful?
0 out of 5 stars
5 Stars 0%
4 Stars 0%
3 Stars 0%
2 Stars 0%
1 Stars 0%
5
How can we improve this article?
Please submit the reason for your vote so that we can improve the article.
Table of Contents

Sintel Apps

Create apps on Microsoft 365 in minutes with no code.

Address

River House
Blackpool Park,
Cork, T23 R5TF,
Ireland

Support

  • Product help
  • Community site
  • Submit a ticket
  • Compare us

    Contact us to

    • Book a demo
    • Request a license
    • Become a partner

    e-mail: info@sintelapps.com
    tel: +353 (0) 21 245 2935

    Follow us

    • Follow
    • Follow
    • Follow

    © Copyright 2026 | End User License Agreement | Privacy Policy | Terms Of Use

    Sintel Apps
    Sintel Apps Assistant
    Get instant answers and support
    Connecting to Sintel Apps Assistant…
    Sintel is thinking…
    We use cookies to collect and analyse information about the users of this website. Please click 'I accept' to consent to the use of this technology.