Search for answers or browse about Sintel Forms.
Calculated Column
Sintel BI introduces a powerful feature called ‘Calculated Column,’ allowing users to create custom fields within a data source with values dynamically computed based on JavaScript expressions. This feature enhances the flexibility and customisation options for users working with data in Sintel BI.
How to Add a Calculated Column:
- Navigate to the desired data source tile in Sintel BI.
- Click on the f(x) icon located at the top of the data source tile.
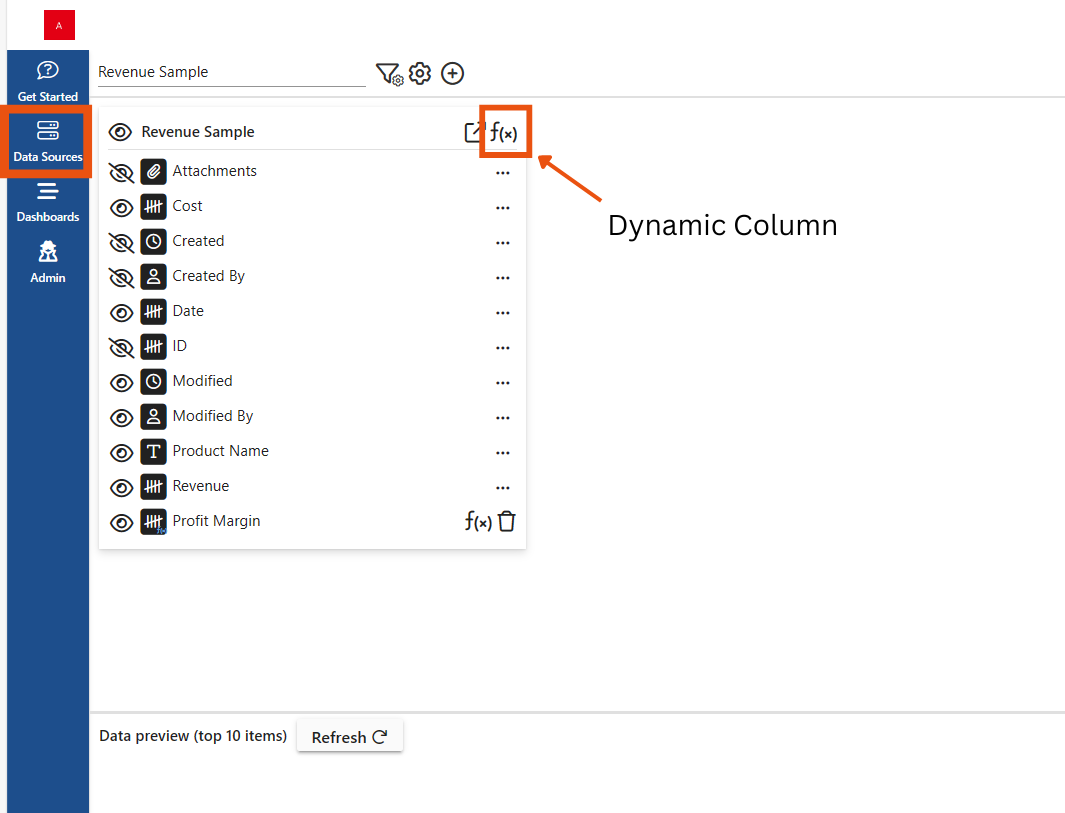
- Give the calculated column a name to easily identify it.
- Add the formula using JavaScript expressions. You can utilize the ‘@’ symbol to easily include field values in your formula.
- Select the column type based on your data requirements: Single Line of Text, Number, Date/Time, or Yes/No.
- Save your changes.
Examples of Use:
- Track Project Status and Days Overdue:
- Column Name: “Days Overdue”
- Formula: Interval.fromDateTimes(DateTime.now(), DateTime.fromISO({[Deadline]})).length(‘days’)
- column Type: Days Overdue =Number
- Usage: In this example, the user has added two calculated columns to track project status and days overdue:
- Status Column: This column indicates whether a project is “Due” or “Overdue” based on the project’s deadline compared to the current date.
- Days Overdue Column: This column calculates the number of days overdue for each project. It utilizes the Interval.fromDateTimes() function in JavaScript to compute the length of time between the current date (DateTime.now()) and the deadline date ({[Deadline]}), which is a field value in the data source.
By adding these calculated columns, users can gain insights into project statuses and identify overdue projects at a glance, thus facilitating better decision-making and project management within Sintel BI.
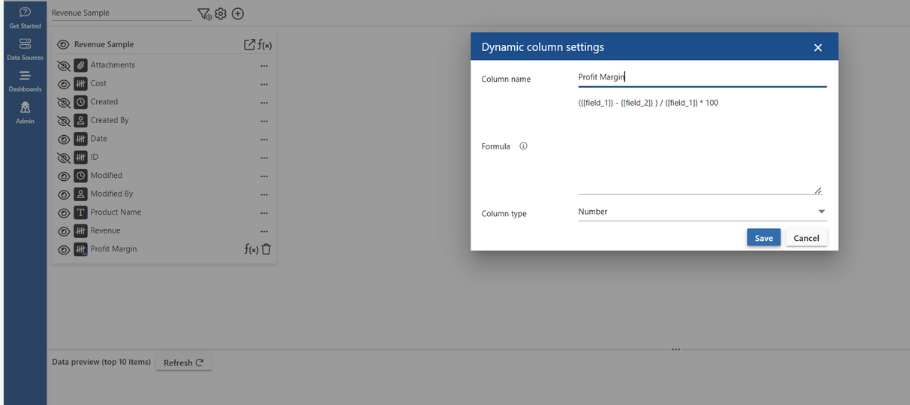
- Calculating Profit Margin:
- Column Name: “Profit Margin”
- Formula: ({[Revenue]} – {[Cost]}) / {[Revenue]} * 100
- column Type: Number
- Usage:This formula calculates the profit margin percentage using revenue and cost data from your source. To use it effectively, ensure you have columns representing revenue (number) and cost (number) within your dataset. When incorporating the formula into your dynamic column, remember to tag your revenue field as ‘@revenue’ and your cost field as ‘@cost’. The formula should then appear as follows: (@revenue – @cost) / @revenue * 100. Tagging ensures that the formula accurately accesses and calculates the profit margin based on your specific revenue and cost values.
Additional Tips:
- Use JavaScript expressions to create dynamic and conditional calculations.
- Leverage existing field values in your formulas using the ‘@’ symbol.
- Test your formula to ensure it produces the desired results before saving.
Conclusion:
The ‘Calculated Column’ feature in Sintel BI empowers users to add dynamic, custom fields to their data sources, enabling enhanced analysis and reporting capabilities. By incorporating JavaScript expressions, users can create versatile calculated columns tailored to their specific business needs. Experiment with different scenarios to unlock the full potential of this feature and elevate your data analysis in Sintel BI.