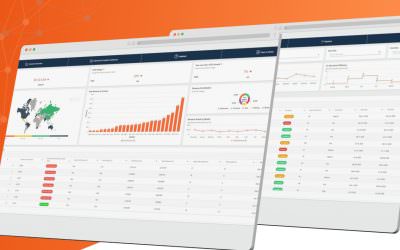
Business Intelligence is a dynamic tool that helps you to break down large amounts of data into critical information in the form of dashboards and reports. These dashboards and reports provide you with vital information that enables you to make quick and informed business decisions.
While many people use the words dashboard and report interchangeably however they are actually quite different.
What are Reports
Reports are a comprehensive collection of data from different sources. The data presented in a report will aim to highlight a particular topic. The scope of a report can be broad or narrow.
They allow you to analyse the raw data such as a list of the New projects won or a list of invoices issued and are generally in tabular format. They generally have a very specific purpose and can often span numerous pages.
It is often possible to link an element on a dashboard to a report so that clicking on an element will enable you to drill down into the underlying data to better understand the data.
For example, clicking on a ‘number of projects won’ summary tile on a dashboard would then open up a report showing the details of those projects.
Traditionally a report was static meaning it did not contain live data. However, in the case of Sintel BI, this is no longer true.
If you create a dashboard with a grid on it, it’s essentially a report BUT it does display live data i.e. if more list items are added, the screen will refresh to display them.

What are Dashboards
Dashboards are visual displays of the most important information needed to achieve one or more objectives. They can be very useful for getting a high-level overview of how a company is doing by summarising key items such as New projects won, PO’s received, Invoices issued, Invoices paid, New tickets, Closed tickets. Average response time.
While there are exceptions a dashboard will generally display all this information on a single screen or page. If they are designed correctly they should be very easy to understand even with just a passing glance.

Dashboards are designed to be understood at a passing glance (just like your car dashboard)
In addition, dashboards can be as broad or as narrow as needed. Businesses may find it helpful to have multiple specific sets of dashboards in order to organise their analytics.
For example, a sales department may have dashboards to track sales performance, revenue and opportunities, while a marketing department can have dashboards for marketing leads, advertising and website traffic.
The same dashboard won’t work for everyone. The needs of a manager, a customer services rep, an accountant and someone who works in HR will be very different.
Dashboards can pull data from many different sources. This makes it easy to combine information and metrics to make the information presented relevant to the person looking at it.

How are Reports and Dashboards similar?
In reality, reports and dashboards have more differences than things in common, however, some key similarities are:
- Both reports and dashboards are tools for presenting data.
-
They have similar visual content in the form of charts, key performance indicators (KPI’s), images, and graphs.
- Both reports and dashboards elements may be filtered and sorted.
How are Reports and Dashboards different?

Content
Dashboards contain a collection of charts and tables on a range of related topics whereas reports contain charts and tables on a single topic. As such dashboards typically offer a high-level overview of a subject, and reports tend to be narrower in focus.
Size
Dashboards are typically designed to be viewed on a single screen whereas a report can be any number of pages.
Level of background knowledge required
Due to the concise nature of dashboards, an inherently higher level of knowledge will be required when viewing them. As the purpose of a dashboard is to deliver short, consumable bits of information, dashboards will not usually contain the same level of explanation that you would find in a report.
Which one Should I use?

As different users have different skills and needs, it is important to have a BI environment that enables all users to interact with their data as needed.
Reports are helpful where you need to go into the nitty-gritty information, a dashboard can often be useful to a lot more people. They are simple and give you the basic information that you want but If you need to delve into it any further then you can go for a report.
At its core, business intelligence is about providing the right information in the right format at the right time.

Thanks for reading and to learn more about Sintel check out our features or testimonials.
If you would like to learn more about Sintel Forms or Sintel BI book a no-obligation demo.
For the latest updates follow us on LinkedIn/Twitter & YouTube.


0 Comments