


- Am I happy with my current financial position or could I budget more effectively?
- How does my income compare to my expenses?
- How am I spending my money?
The dashboard also provides a list of all of the individual’s financial transactions. The user can provide the background data needed to visualise this information by either keeping an up-to-date excel sheet, filling out a Sintel Expense Form outlining their expenses.
What does the dashboard look like?
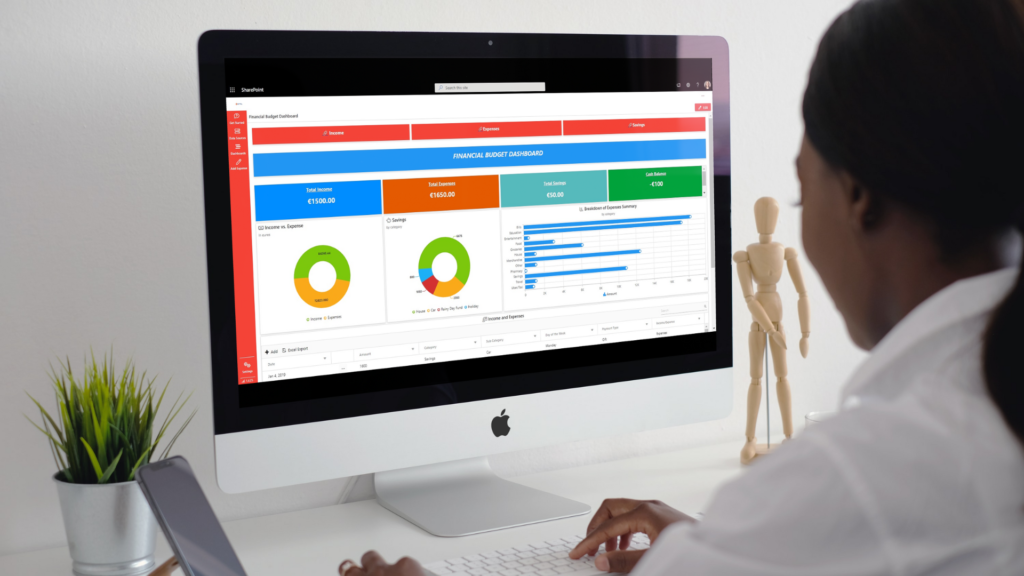
Financial budgeting dashboard
First, the “Income,” “Expenses,”, and “Savings” components are clickable links which enable you to see a more detailed breakdown of your income, expenses and savings. These dashboards have another summary tile called “Overview ” which brings the user back to the main Financial budgeting dashboard.
Next, the “Total Income”, “Total Expenses”, “Total Savings” and “Cash Balance” summary tiles supply a simple analysis of what money is coming in versus what money is coming out. Having an accurate, straightforward representation of these numbers is extremely important for a person’s financial security.
The Income vs expense doughnut clearly indicates whether your income is larger than your expenses. If it is not that is a clear indication something needs to change in your budgeting and finance.
The Savings doughnut chart breaks down your savings in whatever way you categorise them for example House, car, holidays or Rainy Day Funds.
The dashboard looks great across all your devices
The Expenses Summary bar chart provides details of the user’s expenses by category. Of course, if the user wants any further information about their income, expenses or savings they can find that in the individual dashboards for each.
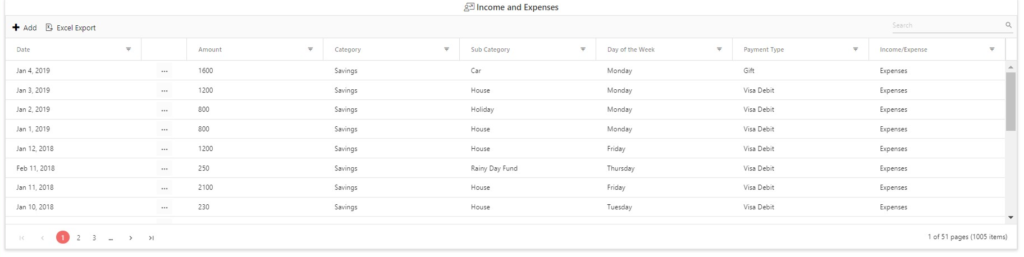
Income and Expenses Grid
The final component of this financial budget dashboard is the income and expenses grid which provides all the details of the user’s income and expenses for example date, amount, category, day of the week and payment details.


0 Comments