


Our Expense Approval App
What the customer needed
- A custom form with an approval workflow
- A custom user interface
- Employees needed to submit expenses & view their previous submissions
- Approvers needed to see expenses claims awaiting their approval
- Finance needed an overview of all expense claims
How we did it
1. Sintel Forms
This provided the data capture i.e. the forms and an approval workflow.
Our form is responsive, it looks good regardless of the device used.
2. Sintel BI
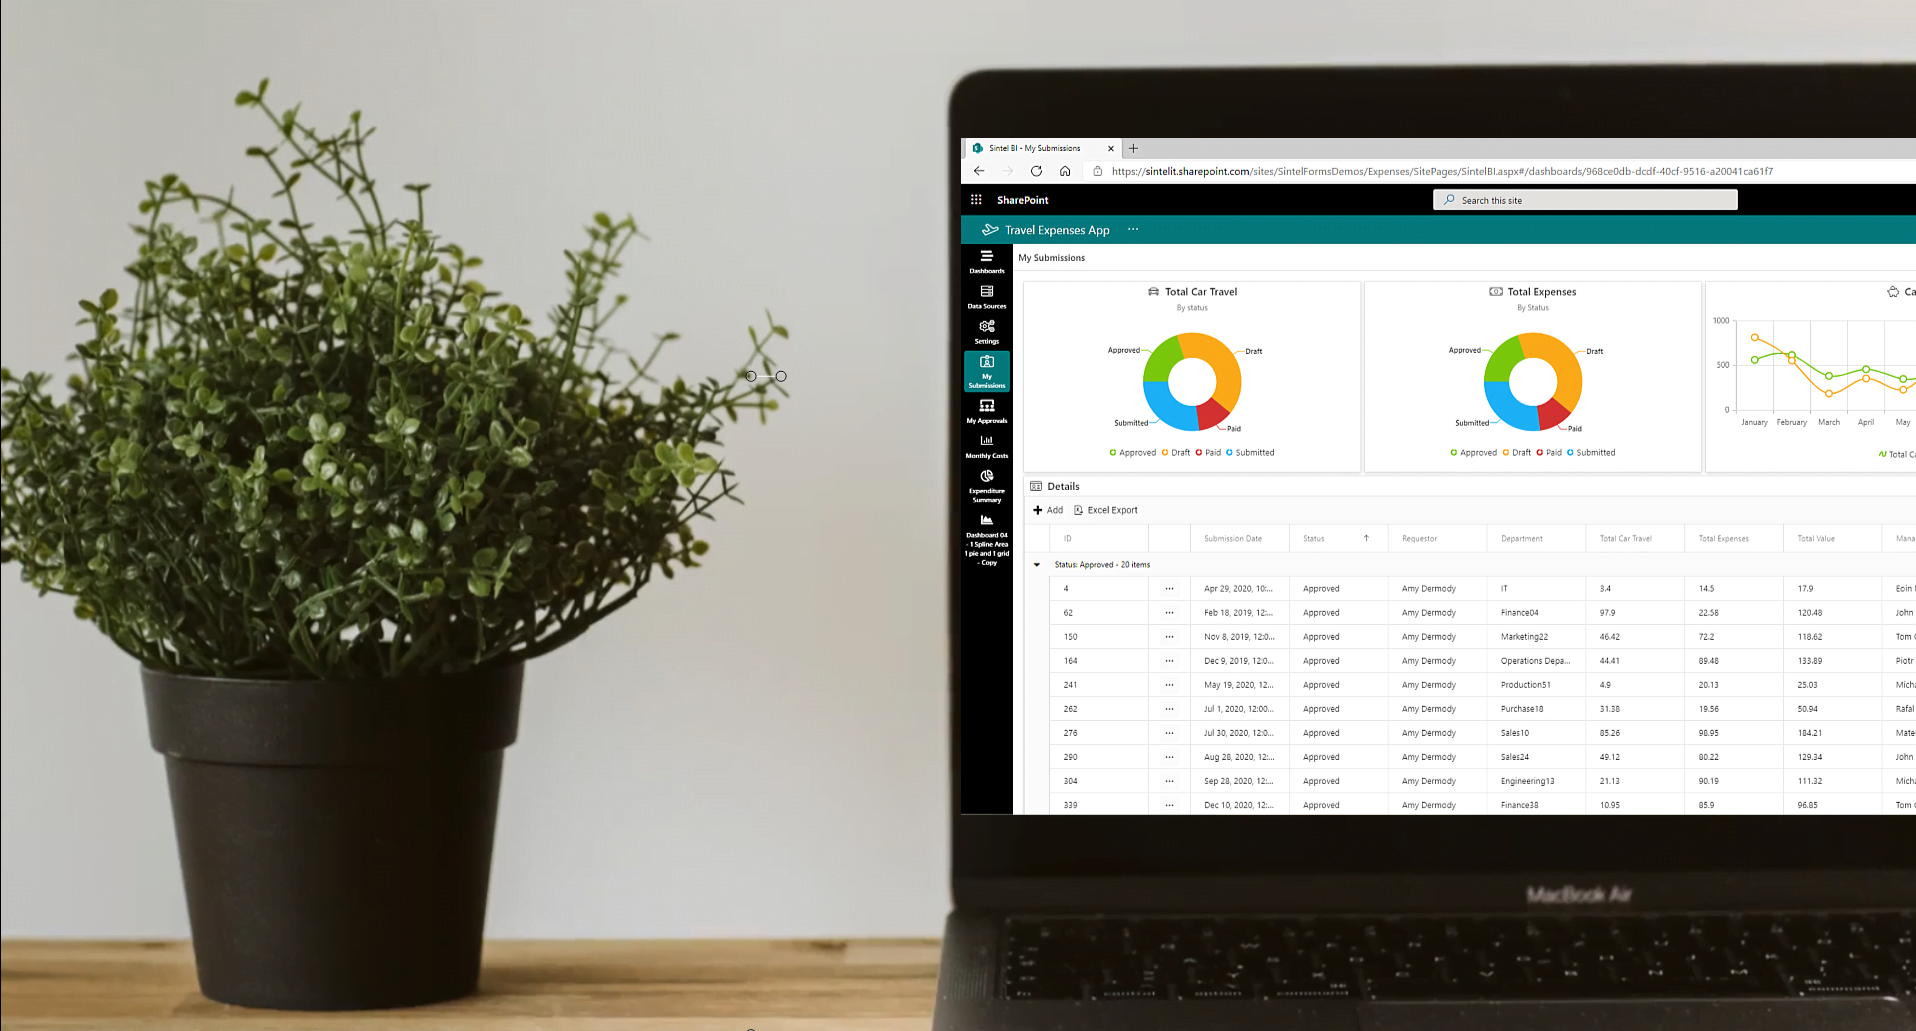
This provided the user interface and the screens/dashboards for the various types of users.
Our custom User Interface provided by Sintel BI
Steps to build the app
Essentially, there were only two steps to creating this expense approval app.
#1 Create the form using Sintel Forms
#2 Create the dashboards using Sintel BI
Step 1 Create the form
Creating a form with Sintel Forms Studio is a simple and intuitive experience.
Once you open the Sintel Forms Designer there are 4 screens and you simply work your way from left to right: Settings →Layout→ Workflow→ Logic
Settings
There are loads of settings that can be enabled such as applying a specific theme to brand your form, enable PDF exports, conversations, workflow etc… For our purposes, we applied a custom theme and enabled workflow.
Layout
You can design any layout you need using our drag and drop designer. In our case, we divided the form into 4 main sections: Your Details, Receipts, Car Travel and Summary.
We decided on the Properties for each section and then added containers into which we dropped the various fields we needed.
In the Your details section, we added a ‘Person’ field to the container and set it’s label to ‘Requester’. In the field properties, we set the State to be Mandatory so the users’ name would have to be entered to allow them to submit a form.
We then added linked lists for both Receipts and Car Travel to enable users add linked items for each category of expense items.
In the Summary section, we added fields to calculate the totals for receipts, car travel and an overall total. This was achieved by using the field properties to make them calculated and entering the appropriate formula.
Setting the Field Properties to ‘Has Calculated Value’ so the totals are automatically calculated for the user.
Workflow
We configured the workflow in the form so that it had 5 possible statuses: Draft, Submitted, Approved, Rejected and Paid. We also enabled emails to be sent to recipients(s) when a form changes status or when an action is assigned
Note: actions can be assigned to specific people or groups.
Sintel Forms Workflow configured to send emails on form status change.
Logic
Logic makes it easy to apply rules to your form. One example of a rule we added to this expense claim form was to set the form to ‘Read Only’ once the expenses had been paid.
To do so we choose ‘Add Rule’ and then dragged the ‘Workflow status’ condition into the conditions box. We made sure that this condition was active, that the “operator” was set to “equals to” and then selected the “Paid” workflow status.
Once we had done this, we added the step ‘Disable or hide features’ to the step box and set it to disable the save button, make the form read-only and hide all workflow actions.
This rule was then able to make the form read-only once the form workflow status was set to Paid!
How to add a Rule & configure it.
Step 2 Create the dashboards
Sintel BI makes it incredibly easy to create dashboards containing components such as grids, charts, images, text and summary cards.
To create an app like our expenses dashboard all you have to do is: Define the Data Source →Create the Dashboard→ Connect the Data
#1 Define the Data Source
In our case this step involved choosing the lists we wanted to use as our data source. We actually created 4 data sources (1 for My Submissions, 1 for My Approvals, 1 for Car Travel and 1 for Expenses). The process of creating the data sources is simple and only requires that you select the source (in this case a SharePoint list) and then choose the columns of data you want to include and apply any filters you may need to apply. In the case of the “My Submissions” and “My Approvals” data sources, this meant that we applied a filter where Requester=Me or Approver=Me to ensure only the relevant data was returned from each data source.
The Data Source screen showing the selection of a list and applying a filter.
#2 Create the Dashboard
When creating a dashboard the drag and drop interface of Sintel BI enables you to easily resize the various components to configure any layout you need. Doughnut charts are a popular way to display data in a very understandable format so the first thing we did was add one. We planned to display the total car trips and the status of the expense with data captured from the Sintel Form we created in step 1. The doughnut chart also enables you to adjust the inner and outer radius of the chart as well as adjusting the placement of the legend and labels. There are many other settings that can be used so the customisation options are very extensive.
The Dashboard creation screen with charts & a data grid but not yet connected to a data source.
#3 Connect the Data
Once we added the various components to our dashboard we simply needed to connect each one to the relevant data source. For example, on the “My Forms” dashboard we connected the data grid to the “My Forms” data source which ensured that when a user opened the “My Forms” dashboard they would only see their own data. For the “My Approvals” dashboard we connected the data grid to the “My Approvals” data source.
Connecting our charts on the dashboard to the data source.
And once it’s connected this is how it looks…
Our doughnut chart once it’s connected to the data source.
To see how we did this check out this short clip.
Thanks for reading and to learn more about Sintel Forms check our features or testimonials. If you’re interested in a free, no-obligation demo simply drop us an email info@sintelforms.com.
For the latest updates follow us on LinkedIn/Twitter/YouTube.


0 Comments