


Surveys are a fantastic way to get information. Our clients use them to learn how customers feel about their products or service. Others use them to gather information on employee perceptions and give employees their say on company events and policies.
Using Sintel Forms, companies can quickly gather responses and notify the correct people about incoming feedback. Once you have gathered this feedback a Sintel BI survey dashboard collates this information in one place enabling you to interpret the data in easy-to-understand graphs and charts.
The Form
Creating a survey form on Sintel Forms is very simple.
To get the best out of your survey there are some guidelines you should follow:
- State the purpose of your survey and Decide on your Audience.
First, you need to decide what the purpose of your survey is, what kind of information do we seek to find out and what kind of problems are we trying to resolve.Who do you want to collect feedback from? Is it employees or customers? Is it is a certain age group or income?
By determining your audience you will get to know the opinion of the audience you wish to target. - Preparing the Survey Form
Let your users know why they have been given this survey and the purpose behind collecting the information. Ensure the user knows that their answers are completely private, and will not be shared with anyone outside of the company. - Narrow down your questions.
A survey should be as concise as possible and the questions must be relevant to the data you hope to gain insight into. Try to avoid long wordy questions that may be difficult to interpret. - Make sure you notify the relevant teams when responses come through.
Using the Sintel Forms workflow statuses you can notify teams via email once a survey has been submitted. It is also effortless to notify different teams within your organisation depending on the answers given on your survey. For example, if the person who submitted an answer says they used product A, then the team responsible for product A and those responsible for the overall survey can be notified. If the person submits an answer saying they used product B, then the team responsible for product B and those responsible for the overall survey can be notified.
The Dashboard

Survey Analysis Dashboard
With a survey analysis dashboard, you can quickly see if any changes need to be made for a better customer or employee experience.
For example, in this survey analysis dashboard, you can see from donut charts, bar charts and a grid there are hundreds of data points summarised in one view.
There are endless reasons to use dashboards as a means of analysing the data gathered in your surveys including:
Dashboards centralise your data: You may collate data from different surveys in one dashboard making it simple to analyse diverse data at a glance.
Change data appearance: You can use a variety of graphs and charts to convey different aspects of your data depending on the needs of your project.
Get results in real-time: Your graphs and charts will be updated immediately when new results come in, this makes it easy to communicate important minute-by-minute data with management.
Our sample app demonstrates the significance of a survey dashboard. In the sample app, a company has distributed a survey to its client base. Instead of analysing each reply one by one we can see the results on our dashboard.
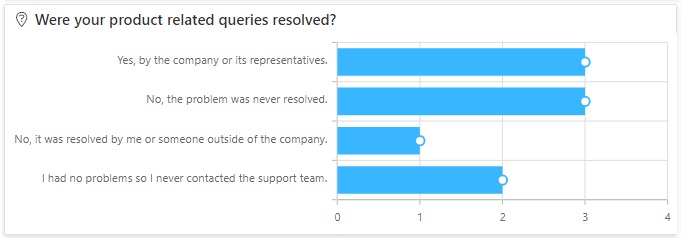
Chart sample
One question on our survey is ‘Were your product-related queries resolved?‘ The choice of answers is:
- Yes by the company or its representatives
- No, the problem was never resolved
- No, it was resolved by me or someone outside the company
- I had no problems so I never contacted the support team
On the bar chart, we can see how many people have selected each response. The company’s aim is to have all responses be: Yes, by the company or its representatives or I had no problems so I never contacted the support team.
When other answers come through, it helps management identify problems in the support team.
It then assists management and the support team in rectifying the issues so that customer care is the best it can be and all queries are answered.
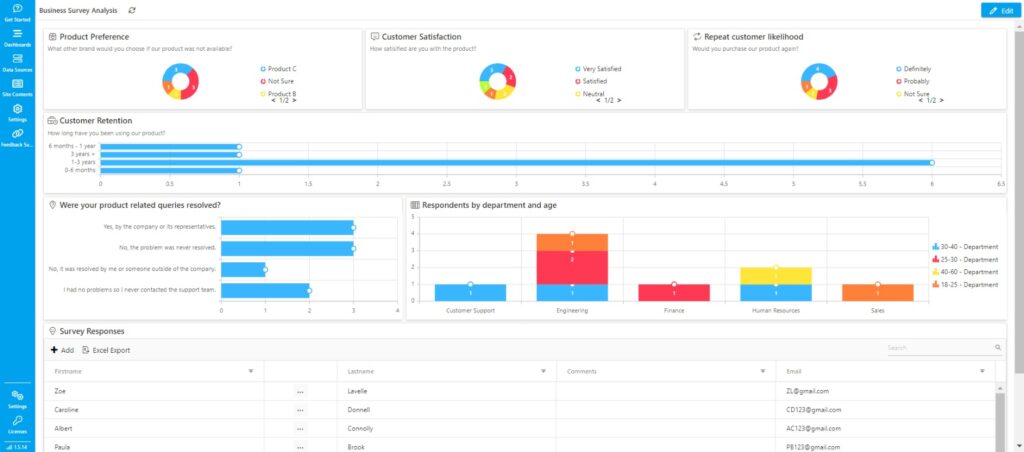
Business Survey Analysis Dashboard
Using a dashboard saves your team from going through loads of individual forms and will assist you to make quicker and better decisions.
It is straightforward to share your dashboards with the relevant stakeholders.
The best thing is that these dashboards show real-time progress so you won’t need to spend time updating static reports and presentations.
In conclusion:
Using a survey app like this helps customer care and sales to improve customer experience, retention and operations. This data gives helpful insights into product/service perception enabling the business to make modifications where necessary.
If you would like to use our free pre-configured survey app contact us at info@sintelapps.com


0 Comments